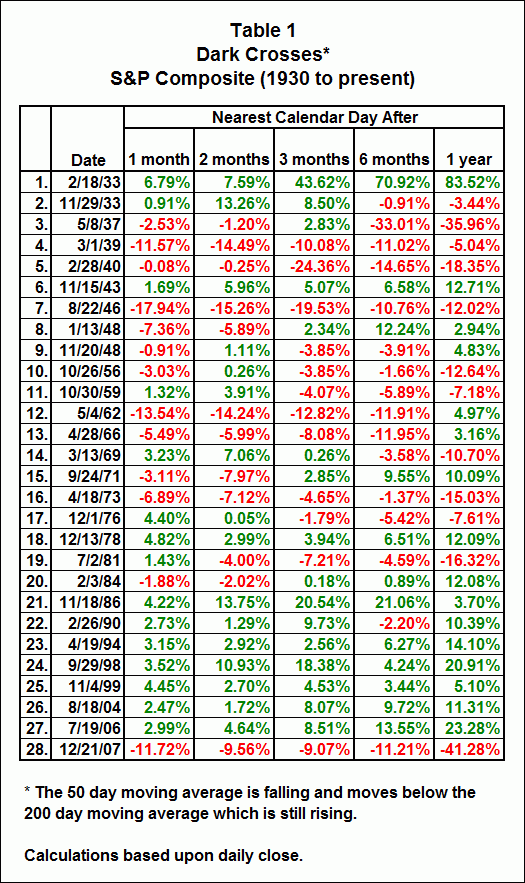
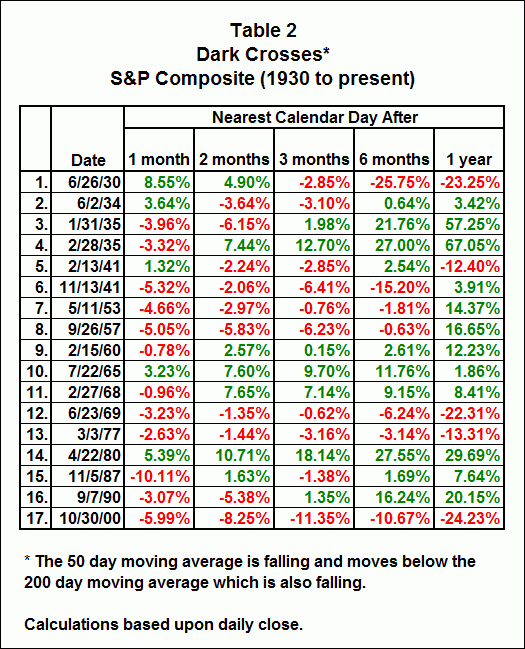
The Financial Press has been full of stories about so called “Dark Crosses.” We did some analysis on our S&P Composite data from 1930 and present the following two tables. The first table shows the performance of the S&P Composite for the time periods listed when the 50 day moving average is falling and crosses the 200 day moving average while the 200 day moving average is still rising. The second table shows the performance of the S&P Composite for the time periods listed when the 50 day moving average is falling and crosses the 200 day moving average and the 200 day moving average is also falling.
 选择“Disable on www.wenxuecity.com”
 选择“don't run on pages on this domain”

