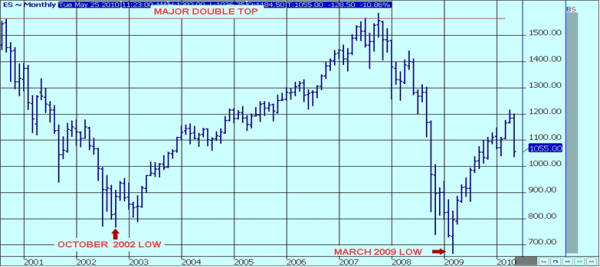
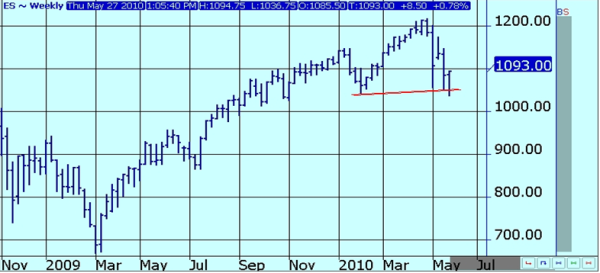
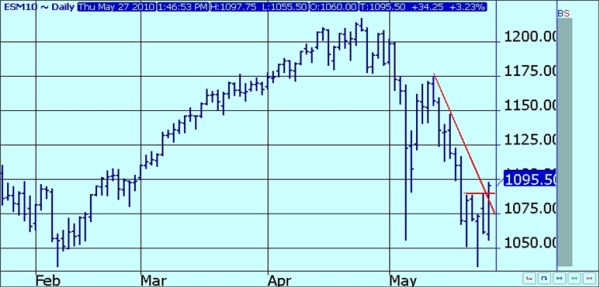
http://insidefutures.com/article/153134/S&P%20500%20Futures%20-%20Technical%20Commentary.html S&P 500 Futures - Technical Commentary Thursday, May 27, 2010 by Alan Bush of Archer Financial Services S&P 500 Futures - Technical Commentary By Alan Bush, Archer Financial Services Mark Twain said, "History doesn’t repeat itself - at best it sometimes rhymes." This line of thinking can be applied to what often takes place in the commodity markets, especially when it comes to double top and double bottom chart formations. The move to new historical highs in October 2007, above the double top formation that was formed at the 1565.75 high in 2000 and the 1566.25 high in July 2007, appeared to be mostly short covering. The price action that ensued showed this double top upside breakout was an example of a false breakout. One clue to the potential for a false buy signal was that when prices exceeded the double top, there was a pattern of the declining volume and open interest that took place at the time of the breakout. The rule of thumb is that a higher futures price on declining open interest and on light volume can be an indication that the breakout will be a false one. S&P 500 Futures - Monthly Continuation Chart Provided by APEX Another rule of thumb is a market often will bottom after the very last chart support area has been taken out and the chart pattern looks horrendous. It would appear logical that the last of the longs would have probably given up when the six and a half year low had finally been penetrated. This demoralizing drop in prices had to be an additional reason for the "last of the stubborn longs" to finally liquidate. This situation took place in March of 2009, when futures fell below the October 2002 low of 767.25. An astute technician may have correctly predicted that a major buying opportunity would not present itself until the likely resting sell stops under this "ultimate" support area were taken out. Ample time should be allowed for the likely new technically induced selling that will probably be generated by a price drop to a new low for the move. After the lows were registered in March 2009, prices were able to sharply advance. Many times, it is only after the longs have thrown in the towel and liquidated that futures can embark on a new bull market. There is another technical lesson to be learned from the chart below. Anytime there is an obvious chart sell signal, such as double bottom breakout, after a long decline with limited follow through, sometimes the chart "sell signal" can actually be construed as a chart "buy signal." Some technicians might call this a trend line and not a double bottom because of the slight upward slope. However, the same rules apply. This "fade the crowd" indicator worked well in this case, since prices were able to substantially advance after the false sell signal was generated. S&P 500 Futures - Weekly Continuation Chart Provided by APEX This weekly chart contains a very good example of a downside breakout with limited follow through that has the potential to be the beginning of a major reversal to the upside. The following daily chart of the June S&P 500 futures is already starting to show an improvement in the technical outlook.