The Weekly Report For November 12th - November 16th
The Weekly Report For November 12th - November 16th
|
| Commentary |
The markets in the United States moved sharply lower this week amid the ongoing uncertainty surrounding the so-called "fiscal cliff." If the President and congressional leaders cannot agree on a new plan by Jan. 1, 2013, approximately $600 billion in broad tax increases and spending cuts will automatically go into effect and tip the fragile economy back into recession.
International markets followed the U.S. lead lower in many instances, since a recession in the U.S. would mean a big hit to global economic growth. Indecision in the eurozone has also taken a toll on those markets, while Japan has seen a rapid reversal in its growth. In the end, it appears that monetary stimulus is no longer effective in combatting prolonged slowdowns. |
|
|
|
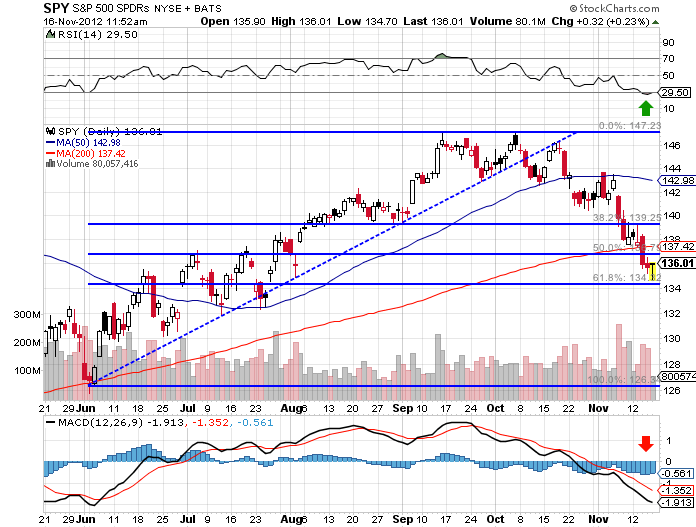
S&P 500 SPDR ETF (ARCA: SPY)
|
 |
|
|
Dow Jones Industrial Average SPDR (ARCA: DIA)
|
 |
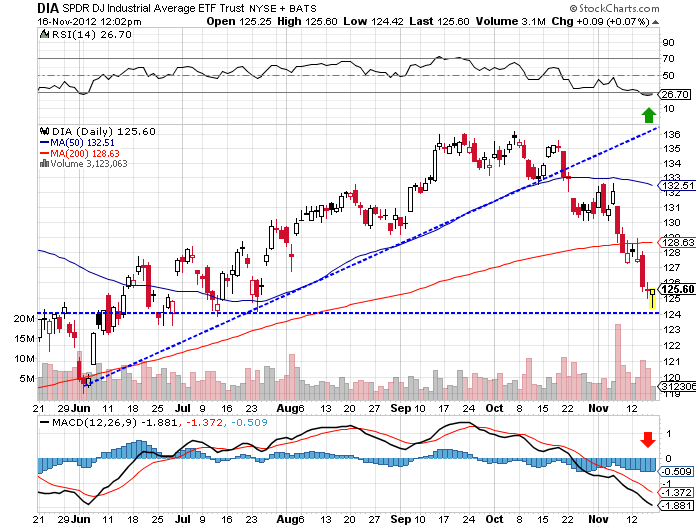
The Dow Jones Industrial Average SPDR (ARCA:DIA) ETF fell sharply below its 200-day moving average at $128.63, finding some support at prior lows of around $124. As with SPY, the RSI indicator appears to be oversold at 26.7, but the MACD indicator remains in a free fall with no signs of a turnaround yet. Traders will be watching for some consolidation at the $124 level before considering any moves higher, while the 200-day moving average at $128.63 will remain a key point of resistance that could limit near-term upside potential.
SEE: Trading The MACD Divergence
|
|
PowerShares QQQ ETF (Nasdaq: QQQ)
|
 |
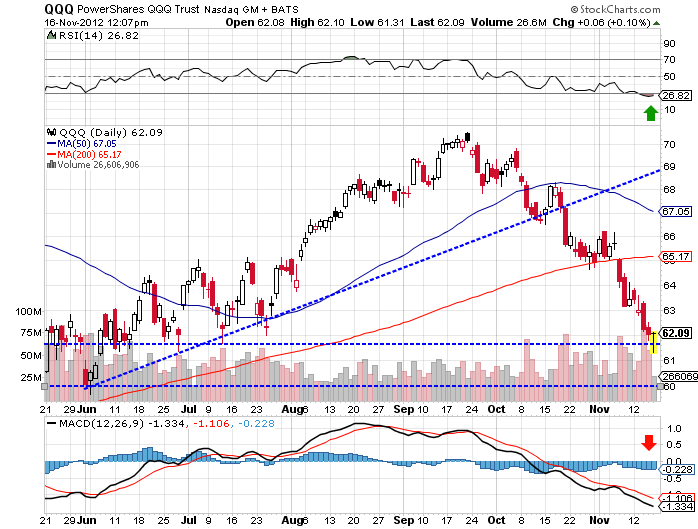
The PowerShares QQQ (Nasdaq:QQQ) ETF moved sharply lower this week to well below its 200-day moving average at $65.17 to lower support levels at around $61.62. As with SPY and DIA, the RSI indicator appears to be oversold at $26.82, but the MACD suggests the opposite scenario, as it remains in a bearish free fall. Traders will be watching for the index to consolidate at the $62 level before making any potential moves higher, while the 200-day moving average at $65.17 will provide a key resistance level and limit near-term upside potential.
|
|
iShares Russell 2000 Index (ARCA: IWM)
|
 |
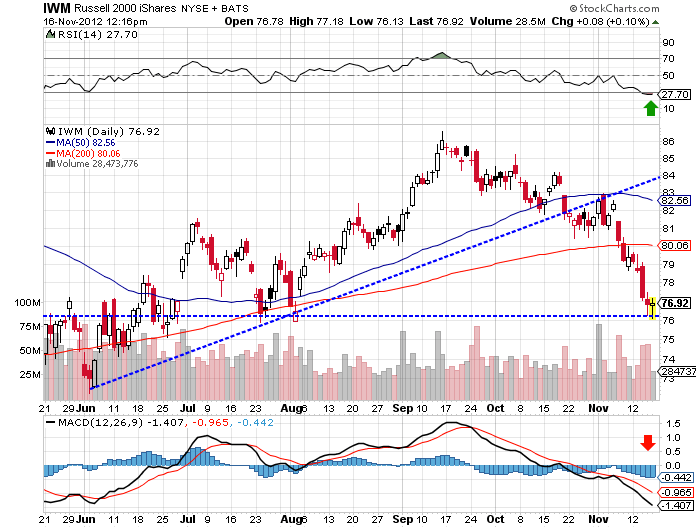
The iShares Russell 2000 Index (ARCA:IWM) ETFmoved sharply lower, along with many other U.S. indexes. It moved below its 200-day moving average at $80.06 to find support at a prior low at around $76.24. As with the other indexes, the RSI indicator appears oversold at around $27.70, while the MACD is stuck in an ongoing bearish free fall. Traders will be watching for consolidation at the $76 level before any moves higher, while the 200-day moving average will provide a ceiling at around $80 for any move higher.
SEE: A Primer On The MACD
|
|
|
The Bottom Line |
|
|
Major U.S. indexes moved sharply lower across the board this week, but now they rest on prior low support levels. With the U.S. Thanksgiving holiday coming up, trading is likely to be on the lighter side next week, especially towards the end of the week. But traders will be looking towards home sales and jobless claims to determine if the support levels will hold next week.
Existing home sales are due out on November 19 and housing starts data is due out the following day. Meanwhile, jobless claims and consumer sentiment data will be released on November 21 and provide the bulk of the potential movement.
Charts courtesy of stockcharts.com
At the time of writing, Justin Kuepper did not own shares in any of the companies mentioned in this article.
|
|
|
您的位置:
文学城 »
论坛 »
大千股坛 »
The Weekly Report For November 12th - November 16th
![]()
![]() (0 bytes)
()
11/18/2012 postreply
16:12:09
(0 bytes)
()
11/18/2012 postreply
16:12:09


