Household Income Percentile Statistics in 2021
Below, see what the household income brackets looked like for the 10th, 25th, 50th, 75th, 90th, 95th, and 99th – top 1% – percentiles in 2021 vs. 2020:
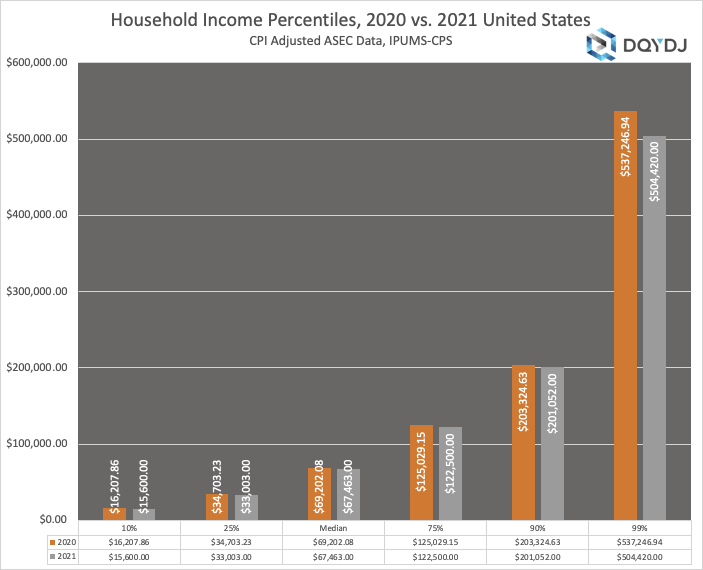
2020 vs 2021 US Household Income Percentile
Below, see what the household income brackets looked like for the 10th, 25th, 50th, 75th, 90th, 95th, and 99th – top 1% – percentiles in 2021 vs. 2020:
2020 vs 2021 US Household Income Percentile
•
你这个图表是哪个州的?应该不是纽约的吧?
-香草仙子-
♀
![]()
![]() (0 bytes)
()
09/24/2022 postreply
17:41:02
(0 bytes)
()
09/24/2022 postreply
17:41:02
•
看样子是全美的吧。
-静听秋雨-
♀
![]()
![]() (0 bytes)
()
09/24/2022 postreply
18:49:35
(0 bytes)
()
09/24/2022 postreply
18:49:35
•
有可能。Top 1%的bar 这么低
-香草仙子-
♀
![]()
![]() (0 bytes)
()
09/24/2022 postreply
19:10:23
(0 bytes)
()
09/24/2022 postreply
19:10:23
WENXUECITY.COM does not represent or guarantee the truthfulness, accuracy, or reliability of any of communications posted by other users.
Copyright ©1998-2024 wenxuecity.com All rights reserved. Privacy Statement & Terms of Use & User Privacy Protection Policy
 选择“Disable on www.wenxuecity.com”
 选择“don't run on pages on this domain”

