Summary
Natural gas equities are priced for bankruptcy, down 50-90% from their highs.
On the surface, record supply growth in 2017 paints a bearish picture.
Under the surface, the data indicates a looming supply deficit by 2019.
Read on for my top reasons why natural gas stocks will outperform the FANGs by 2020.
You can look, but you won’t find a more hated sector than natural gas producers in today’s market. Need proof? Look no further than this recent headline:
"Jim Cramer says natural gas investors should be 'scared.'"
I’m willing to bet this headline will mark a secular low for natural gas equities going forward. In this article, I’ll describe why the natural gas sector provides the single greatest contrarian opportunity in today’s market. This opportunity comes from a massive mismatch between the recent past and the likely path forward for natural gas supply and demand.
The bears believe 2017’s record production surge implies that U.S. gas producers can keep the taps flowing indefinitely in today’s low-price environment. They’ve been suckered into the myth that shale gas drillers can break even at sub-$3 prices, despite clear evidence to the contrary.
The truth is, last year’s short-term production boost came from U.S. shale drillers pulling all available levers to drain their inventories of cheap production. Today, these levers are quickly becoming exhausted. The first part of this article walks through each of these levers one by one. In the second part, I’ll show that a coming wave of new demand will hit the market just as production growth decelerates in late 2018 and throughout 2019–2020.
Let’s get started…
A Capital-Intensive Industry… Needs Capital
Drilling for oil and natural gas is highly capital-intensive. Without massive, ongoing expenditures, gravity takes hold and production volumes drop off. Here’s how it works…
The maximum output for any given well – shale or conventional - occurs on day one. After drilling the well, production rates begin their inexorable declines. The industrywide term for this phenomenon is “depletion.” For shale wells, depletion rates are steep - much steeper than conventional wells. You can see this for yourself in the company presentations for any of the major shale drillers, with charts called “type curves.” Basically, type curves show you how fast production declines after drilling a well. Here’s an example from shale gas driller Range Resources (NYSE:RRC) via their 2018 investor presentation:
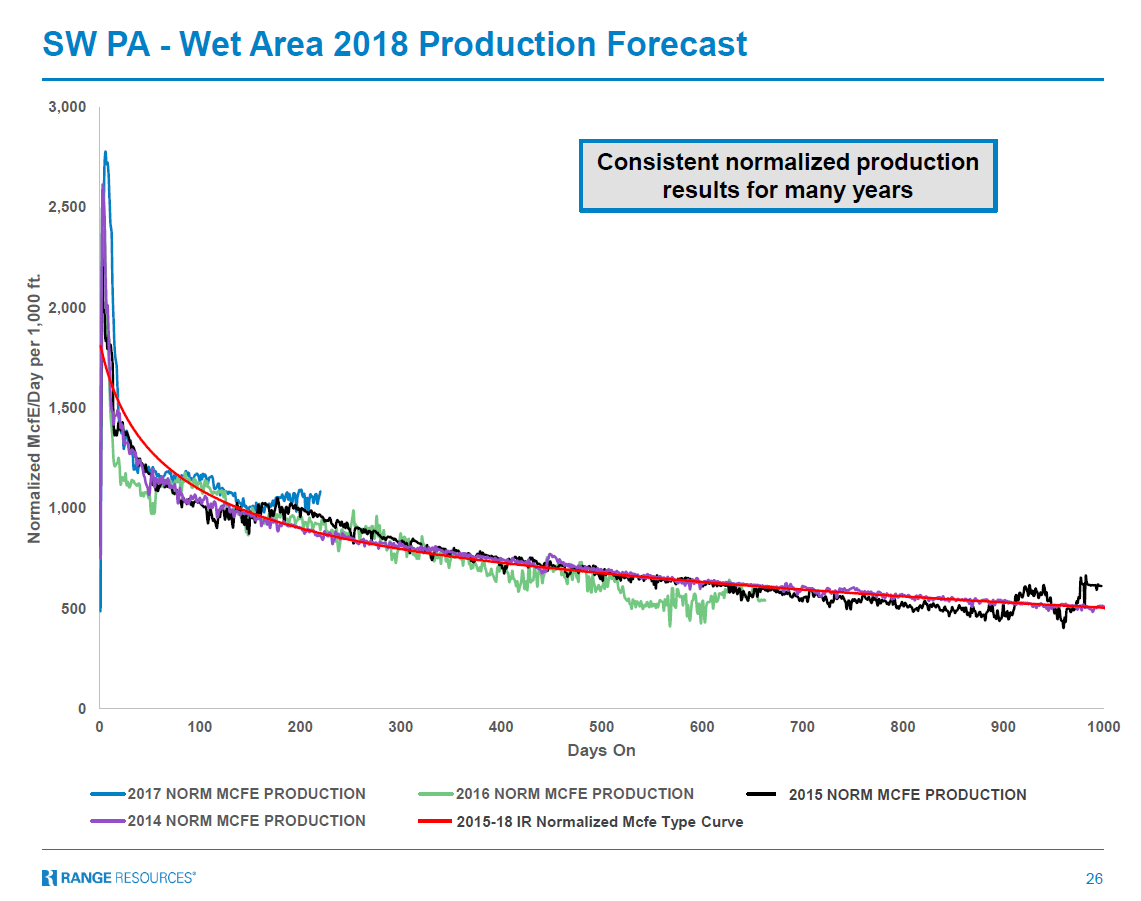
Note how the 2015–2018 type curve (red line) drops from an initial production rate of nearly 2,000 Mcf/day to under 1,000 within the first year. By year three, production falls to just over 500 Mcf/day – a decline of approximately 75%. For most shale drillers, production falls by anywhere from 70% to 90% within the first three years. That’s why the EIA recently estimated that nearly half of all U.S. shale production came from wells less than two years old.
These decline curves mean that shale drillers must continuously add new reserves and drill new wells just to keep production flat, never mind actually grow production. Replacing depleted production volumes is an unavoidable expense if you wish to stay in the business. But here’s the problem… most company executives conveniently exclude this expense when discussing breakeven production costs in their corporate presentations and press releases. It’s also common practice to strip out other key costs of doing business, like SG&A and interest on debt. These headline breakeven numbers are then parroted back by the complicit mainstream financial media, creating the myth of a supposedly endless supply of cheap gas.
But here’s an easy reality check. If U.S. gas producers were generating real economic returns at current prices, it would show up in the form of positive cash flows. Unlike the income statement, which can be adjusted into faux-profitability with accounting shenanigans, cash flows never lie. And over the last ten years, the top U.S. pure-play shale gas producers have done nothing but incinerate billions in cash each year:
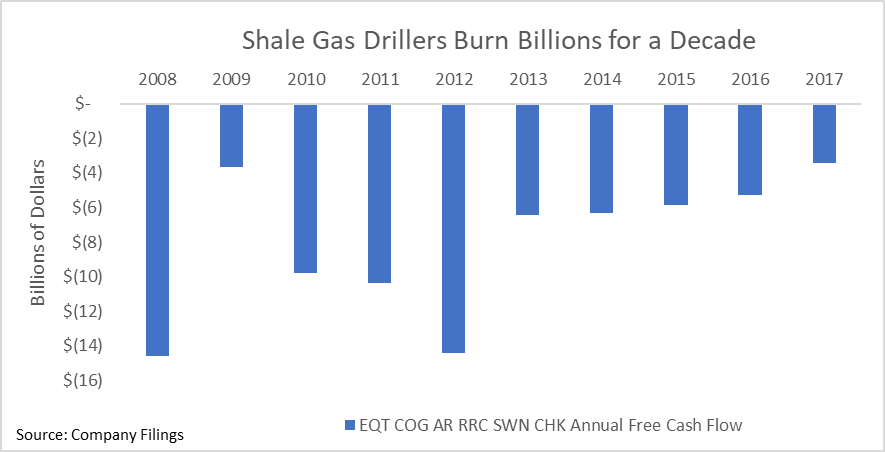
This never-ending cash burn shows that the U.S. shale gas business model is broken at current prices. Of course, this begs the question: how has this gone on for so long? The answer can be traced to the same life force feeding all zombie companies over the last decade – cheap money from Wall Street.
Shale drillers offset bleeding cash flows by issuing massive quantities of debt and equity into a yield-starved financial market. The six companies listed in the chart above – the largest pure-play U.S. shale gas drillers – have tapped Wall Street for $37 billion in financing to help offset their $80 billion in cash burn since 2008. Only in today’s age of excess cheap money could such a situation exist. But what can’t go on, won’t. Investors in these companies have incurred negative returns for an entire decade… they’ve grown weary of throwing good money after bad. During one of the greatest bull markets of our age, shale gas drillers have destroyed over $4 billion in equity value since 2008.
Investors had every reason to run for the hills. Relentless selling over the last four years has pushed share prices of America’s largest gas producers down anywhere from 50% to 90%. With equity prices in the toilet, and interest rates on the rise, the days of endless financing for unprofitable gas production are over. Last year, this group only raised $1.3 billion in cash – the lowest volume since 2009.
But this extreme fear and withdrawal of cheap financing is the necessary catalyst needed to balance the market. We’re already seeing the early stages of this process unfold. Higher funding costs have caused gas producers to slash capital spending and exploration and development budgets, as seen below:
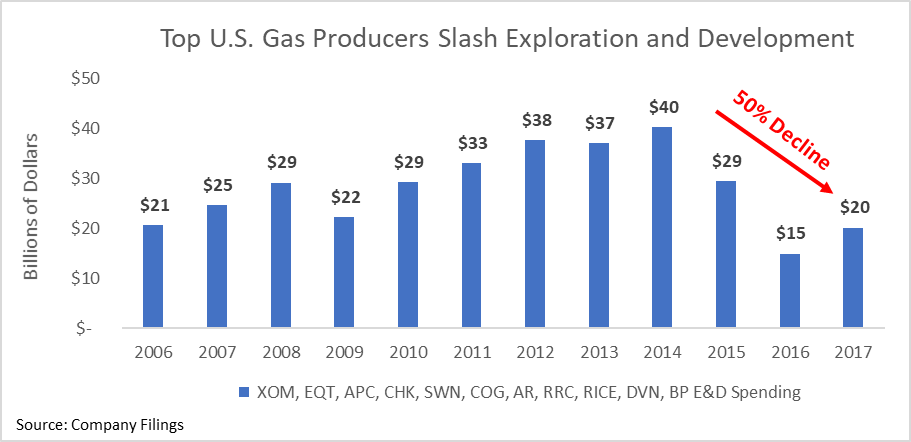
[Note: This universe includes the top 10 U.S. gas producers, including RICE data prior to the EQT acquisition].
Similar trends have emerged in capital expenditure budgets.
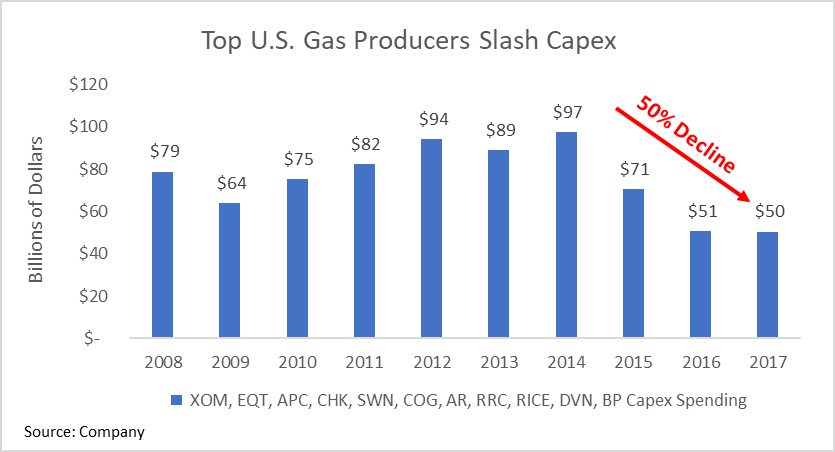
So here’s the quandary that’s confusing the market. Despite this major drop-off in capex and exploration/development, U.S. gas production grew by the most on record in 2017. Have U.S. gas drillers simply defeated the laws of physics and finance, and found a way to permanently boost production while cutting back on capital spending and exploration/development costs? Not so fast.
I’ve identified four key factors that have temporarily boosted production, but which have set the stage for slower growth going forward. These include…
Supply Factor 1: “High Grading”
We’ve all heard the narrative: brilliant entrepreneurs in the shale patch developed incredible efficiencies that have enabled massive supply growth at progressively lower prices. Of course, this begs the question – why haven’t these incredible efficiency gains translated into positive cash flows? But let’s set that aside for now…
One way to think about the efficiency of shale operators is by looking at the volume of natural gas produced per drilling rig. The EIA provides this information for all major shale basins. While there are some flaws with this measure on an absolute basis, it does yield insights when looking at the rate of change through time, presented below:
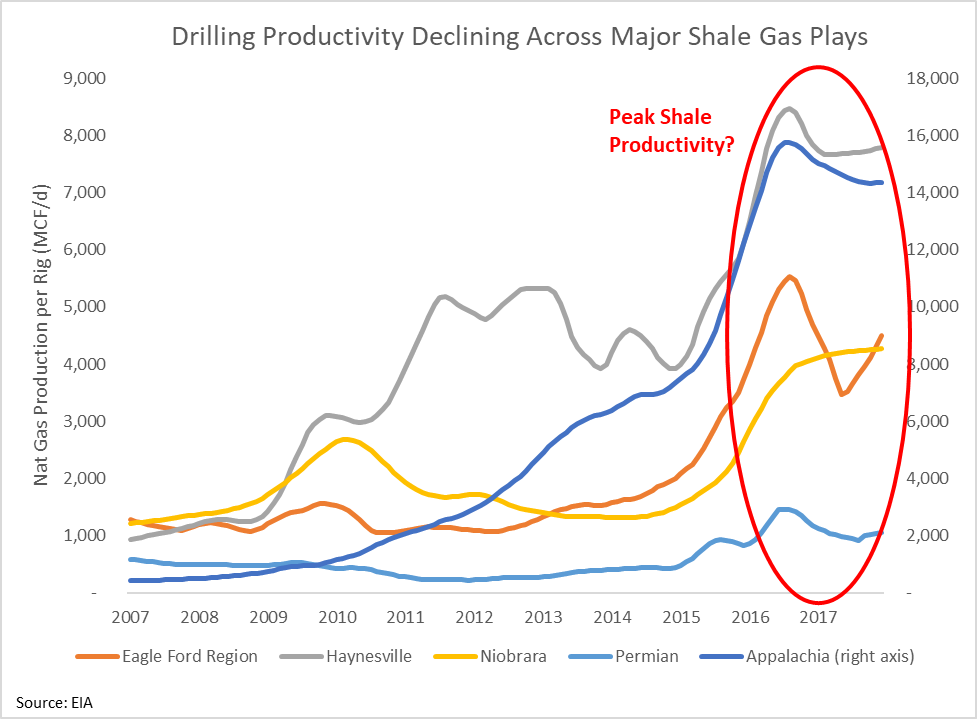
These productivity curves present a few problems for the narrative of technology-driven production efficiencies. First, notice how the steep ramp-up in production per rig happened immediately after the price crash in 2014 for many shale basins. Why did these companies wait for prices to crash to unlock their brilliant efficiency gains? And then, what happened over the last year – did these companies suddenly forget their brilliant innovations and switch back to less efficient drilling methods?
Here’s a more likely theory… what if these companies simply “pulled forward” productivity gains by drilling into their most productive acreage to stay afloat during the downturn? This would create the illusion of temporary productivity gains until these companies burned through their lowest cost/highest output acreage. In fact, such behavior is far from theory. The practice is so common in the resource industry that there’s a term for it, called “high grading.”
Just like the name sounds, this refers to companies which move into their highest grade resource deposits in order to stay afloat during a pricing downturn. This practice lowers costs and boosts output in the short-term, but things move in the opposite direction when the sweet spots become depleted.
Researchers from MIT have uncovered data confirming high grading among both oil and gas drillers during the downturn. The study essentially concludes that the EIA, like many others in the media and financial markets, has mistaken temporary efficiency gains from high-grading for structural efficiency gains driven by technology. Because the EIA mistakes high grading for true efficiency gains, the agency grossly over-estimates the future growth rate of both oil and gas production. This article neatly summarizes the problem:
Researchers at MIT have uncovered one potentially game-changing detail: a flaw in the Energy Department’s official forecast, which may vastly overstate oil and gas production in the years to come. The culprit, they say, lies in the Energy Information Administration’s premise that better technology has been behind nearly all the recent output gains, and will continue to boost production for the foreseeable future. That’s not quite right. Instead, the research suggests increases have been largely due to something more mundane: low energy prices, which led drillers to focus on sweet spots where oil and gas are easiest to extract.”
They follow up with this conclusion:
So even though output in the Bakken more than tripled from 2012 to mid-2015 on a per-well basis, MIT’s research suggests the main reason is that shale companies abandoned iffier fields to drill in the best acreage following the slump in energy prices. The trend is evident in local North Dakota statistics. Output in still-booming McKenzie County has held steady while neighboring Williams and Mountrail counties have experienced declines.”
While this particular study focused on the Bakken, the researchers conclude that the same phenomenon is likely at play in other shale basins. This view is reflected in reports from industry operators on the ground. Consider the following statement from Schlumberger (NYSE:SLB) CEO during the company’s Q2 2016 earnings call:
There is currently also a widespread high-grading of activity taking place in the industry aimed at maximizing short-term production and cash flow.”
The bottom line is clear – shale drillers have provided the illusion of productivity gains by exploiting their sweetest spot acreage during the downturn. This illusion of permanent productivity gains has created a false perception in the mind of the market that gas drillers can continue supplying the market with cheap gas indefinitely. Instead, these temporary gains will reverse as the companies burn through their low-cost/high-grade acreage. We’re already seeing the early stages of this reversal in the data. Going forward, higher prices will be needed to incentivize production from less rich acreage.
Supply Factor 2: Service Cost Deflation
Another key factor creating the illusion of productivity gains has come from massive deflation in oil and gas service costs during the recent downturn. Here again, you almost never see this key factor discussed in the traditional financial media. But the chart below shows it all:
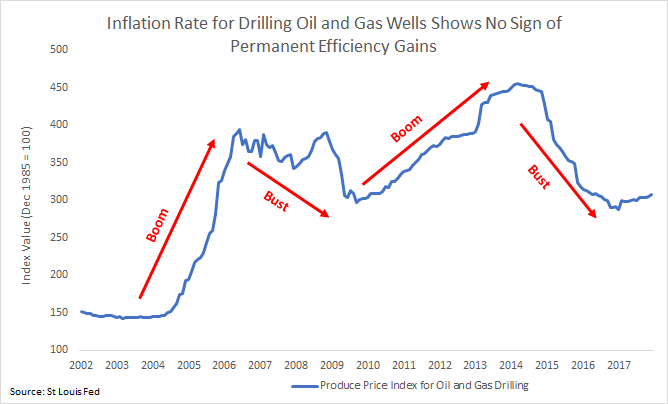
If the shale revolution unlocked incredible new efficiencies, why did costs rise during the peak of the boom years from 2010 to 2014? Did these shale drillers become dumb during the boom and smart during the bust? Plus, when prices soared nearly 300% during the mid-2000s, does that mean the same brilliant drillers became 3x less efficient and less innovative? The answer should be obvious – technology is not the primary cost driver in the oil and gas industry. A technologically-driven cost curve should show a steady downslope over time, like this chart showing semi-conductor cost per unit of computing power: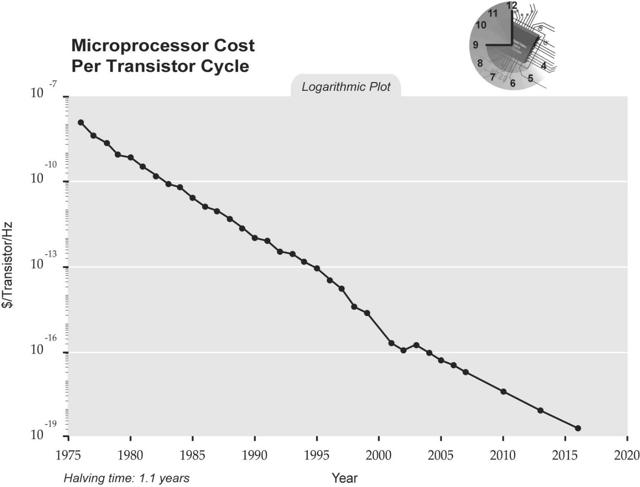
The truth is that the cost curve for shale drilling – like all commodity extraction businesses – follows standard boom/bust cycle pricing pressures. During the boom period, costs rise as more companies enter the space and bid up input prices. During the bust, declining activity creates service-sector overcapacity and price deflation, until excess capacity is wrung from the system. Then, the cycle repeats - boom, bust, boom and bust again.
Thus, the cost efficiencies gained during the bust are another temporary illusion that will disappear when the industry recovers and drilling activity picks back up again. In fact, the chart above shows that we’re already seeing the early stages of cost inflation returning to the shale patch, driven by the recent pickup in oil drilling activity.
Again, it’s not just me saying this. The CEO of Schlumberger – one of the world’s largest oilfield service providers – confirmed this phenomenon occurred during the depths of the bear market in an earnings call from Q2 2016:
The operators have reacted to this crisis by initiating a massive reduction in oilfield activity and by sending unsustainable pricing shock throughout the entire oil industry supply chain…the current cost per barrel for the oil producers now appears to be significantly lower than what was the case seven quarters ago. However, this should not be confused with a permanent improvement in the underlying industry performance as there has been little to no fundamental change in technology, quality or efficiency, no major step change in industry collaboration and no general transformation of the industry business model.”
Supply Factor 3: DUC Drawdowns
Drilled-but-uncompleted wells (DUCs) refer to oil or gas wells that have been drilled, but not yet completed and tapped for production. Most of the hard work has already been done for these wells – the drilling, well-casing, etc. The only thing left to do is frack the wells to unleash the oil and/or gas to the surface. A large volume of DUCs means a lot of potential production can be brought online for much less capex spending compared with drilling a brand new well.
The DUC count in the gas-dominant Appalachian shale basin provides the best indicator of gas wells “on tap” for quick, low-cost natural gas production growth. The Appalachian region includes the prolific, low-cost Marcellus and Utica gas basins. The chart of Appalachian DUCs shows an unmistakable downtrend in U.S. Appalachian DUCs since energy prices peaked back in 2014:
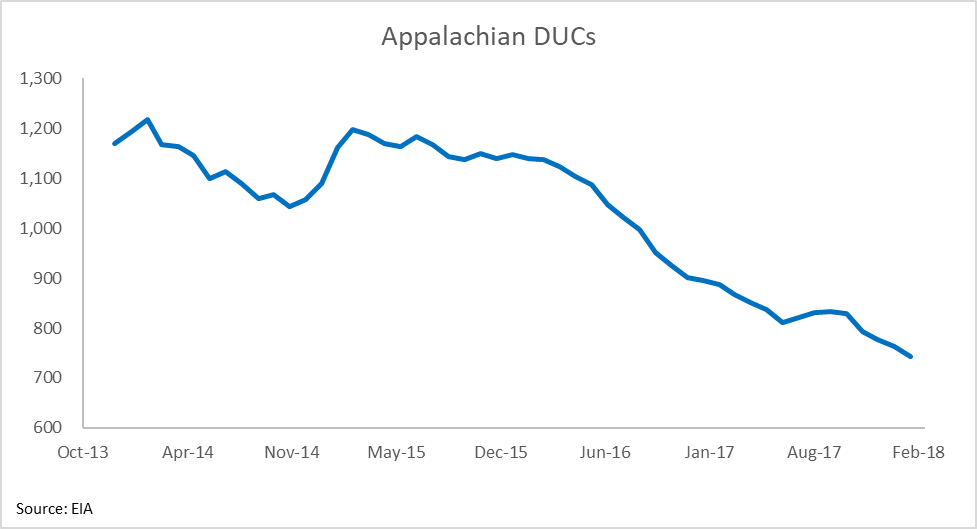
By working down their DUC inventories, gas drillers are delivering production today from yesterday’s capex. Needless to say, this option won’t be available forever. When the DUC drawdown game runs its course, companies will no longer have these cheap, quick production taps to turn on.
Supply Factor 4: Associated Gas Production
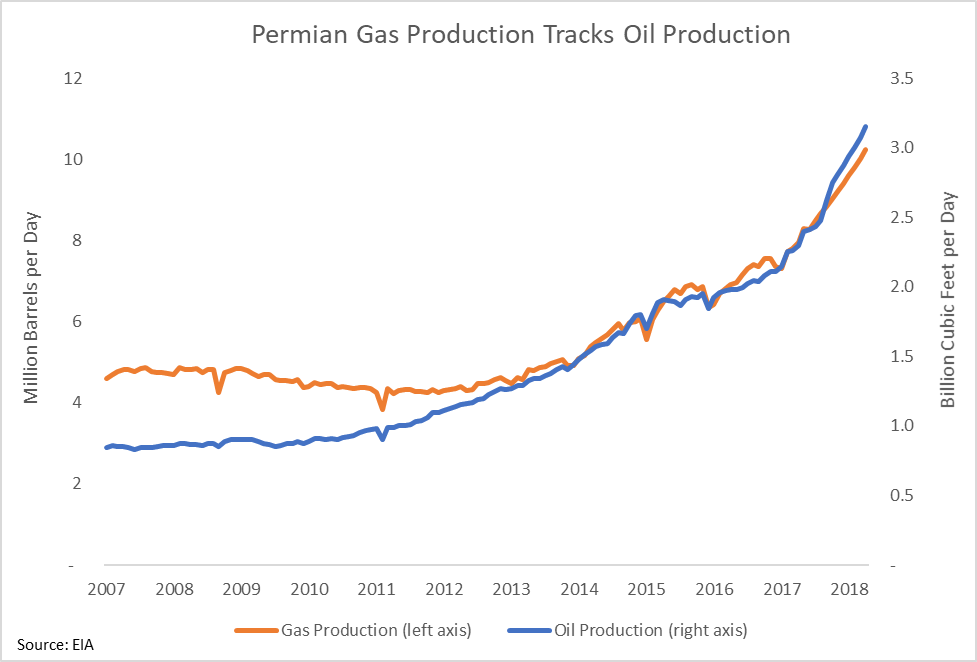
Finally, the growth in associated gas from the Permian has provided a tremendous source of new gas supply in recent years. But this gas has come mostly as a by-product of oil drillers – known as “associated gas.” We can see the clear trend in Permian gas and oil production tracking each other nearly one-for-one since the Permian shale boom began around 2012–2013.
We see similar trends in other oil-rich basins, like the Eagle Ford, where gas output dropped in line with falling production from 2015–2017.
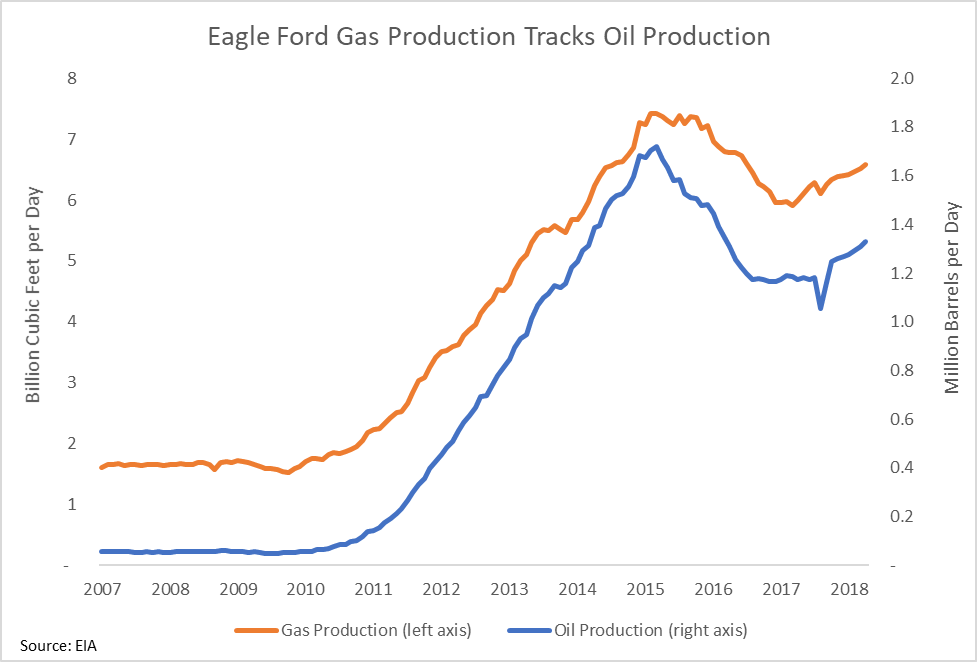
In other words, any slowdown in oil production will take a big chunk of gas volume offline. And there’s every reason to believe that oil production growth will soon decelerate. This topic requires a separate article by itself, but the most straightforward explanation for why today’s oil rally will ultimately reverse: unprecedented hedging from U.S. producers. Today’s record volume of commercial hedging is 50% greater than the volumes that preceded the last bust in 2014:
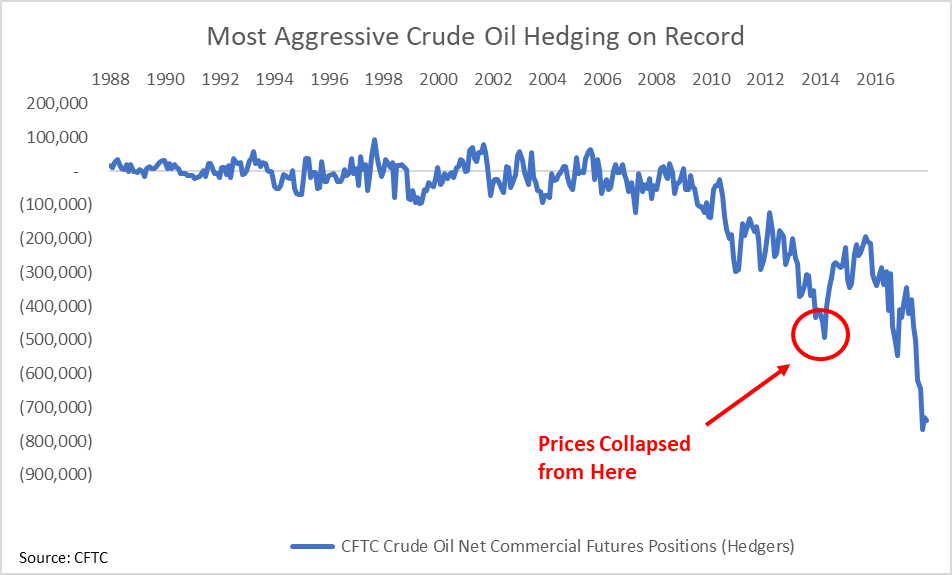
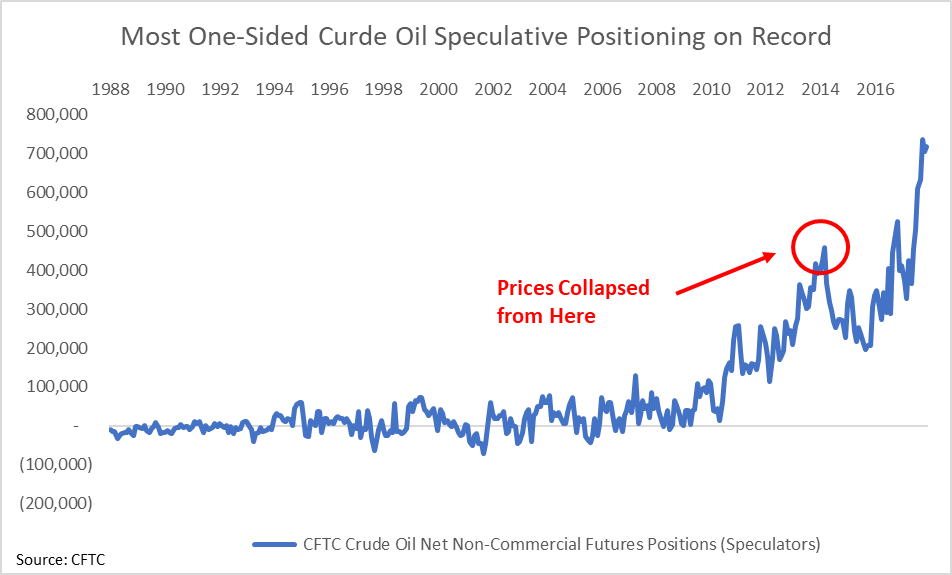
The flip side of record short positions from commercial hedgers is the record long positioning among speculative traders. Speculators have never before been this long the crude oil market. These situations never last – one-sided speculative positioning notoriously marks key inflection points in commodities markets.
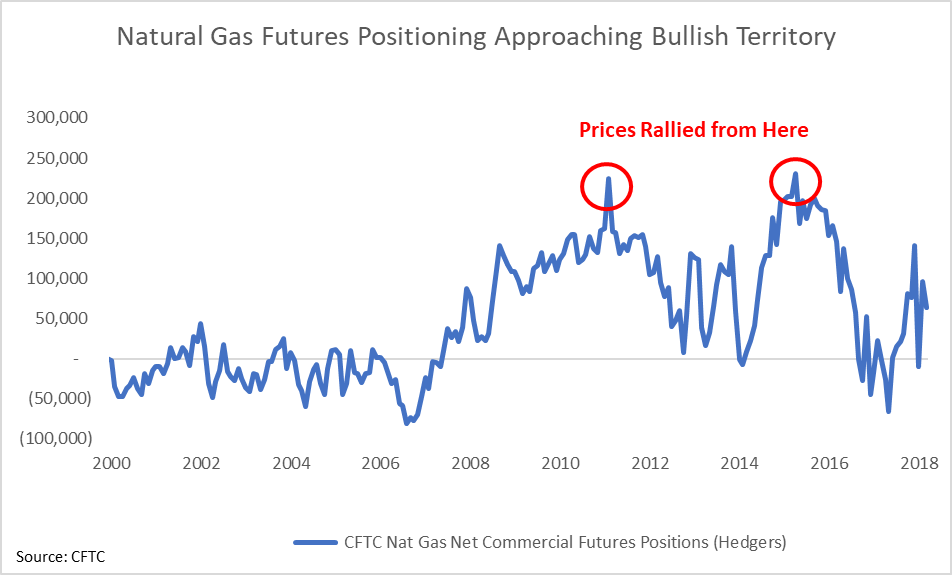
Meanwhile, in the natural gas market, commercial hedgers are leaning more bullish than bearish. In fact, current hedger positioning is approaching levels that preceded previous natural gas price rallies:
As the second wave of the oil glut hits, falling U.S. oil production will take associated gas production down in kind. I expect the oil glut to begin pressuring prices and drilling activity later in 2018 and throughout 2019. The crude oil bear market is far from over.
That concludes the supply side of the equation. Each of these factors points to an exhaustion of this temporary supply growth later in 2018 and into 2019–2020. Decelerating supply growth will meet accelerating demand at precisely the same time. Next, I’ll highlight three key sources of new demand that will power a secular bull market in natural gas, starting next year and running well into the 2020s.
The Coming Tidal Wave of New Natural Gas Demand
They say the cure for low prices is… low prices. It’s trite, but true. A decade of low natural gas prices has stoked incredible new demand sources that will begin coming online in 2018 and beyond. By far, the biggest demand driver will come from the surging LNG export capacity.
Demand Factor 1: LNG Exports
Despite all the press covering the emerging boom in U.S. liquefied natural gas (LNG) exports, the market seems oblivious to its total transformative impact on the natural gas sector. You only need one chart to grasp the power of this new trend:
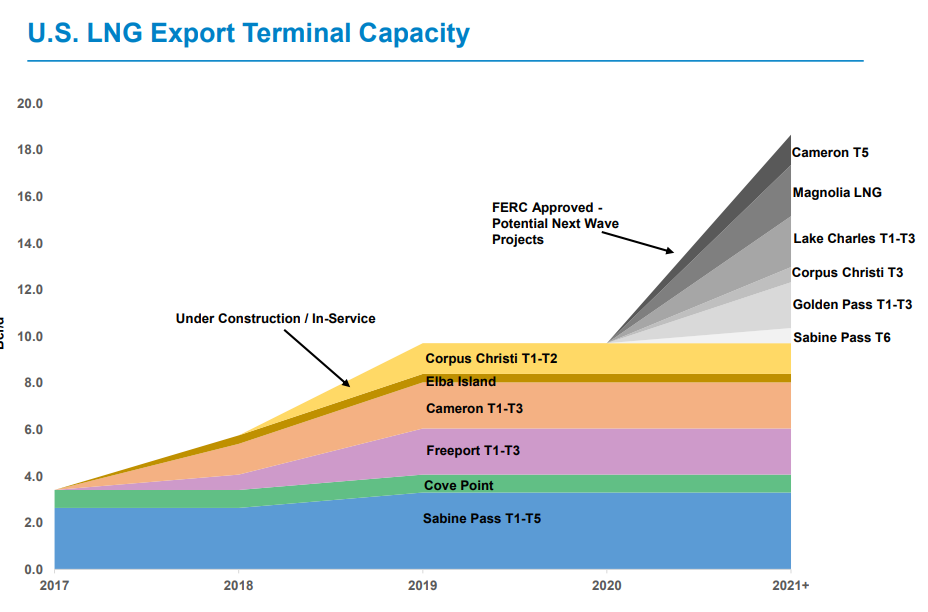
Last year, LNG exports grew from nearly nothing to 2.2 Bcf/d. This year, that number will reach 4.4 Bcf/d. By 2020, we’ll have roughly 10–12 Bcf/d of LNG export capacity, and that number could soar beyond 20 Bcf/d by the early 2020s.
For perspective, the EIA projects U.S. dry gas production will average 81.1 Bcf/d in 2018. That means we’ll export about 5.4% of this year’s U.S. gas production – up from 3% last year. By 2020, we’ll ship roughly 12–15% of domestic U.S. gas supply abroad via LNG.
Unlike the U.S., most countries around the world lack access to cheap, abundant natural gas. But they’re all demanding more of it as a source of clean electricity in place of dirty-burning coal. And because LNG export terminals require billions of dollars to build, they don’t get funding without long-term supply deals. Like the deal made between U.S. LNG exporter Cheniere Energy (NYSEMKT:LNG) and Chinese energy giant China National Petroleum Corporation (CNPC). Cheniere inked a deal to supply 1.2 million metric tons of LNG going out until 2043. So much for the death of fossil fuels.
As always, the driving force of this massive new demand for U.S. LNG comes down to economics. Current gas prices in the U.S. trade for around $2.60 per million British thermal units, compared to more than $10 in Asia and other regions around the world. LNG exports will eventually close the gap between cheap U.S. gas and pricier benchmarks overseas.
Despite the noise from talking heads like Jim Cramer hyping the demise of fossil fuels in place of renewables, tens of billions in capital flows suggest otherwise. The booming global LNG trade is a direct result of more and more countries around the world moving to natural gas as a major electricity source. And it’s not just happening in Asia. We’re seeing the same trends south of our border, which is providing a second major new source of demand for U.S. gas.
Demand Factor 2: Pipeline Exports to Mexico
Like many countries around the world, Mexico is aggressively switching from coal to natural gas-powered electricity generation. The Mexican Energy Ministry (SENER) projects that Mexican gas consumption will soar 50% from 2016 to 2020. There’s just one problem…supply is massively lagging demand, as shown below:
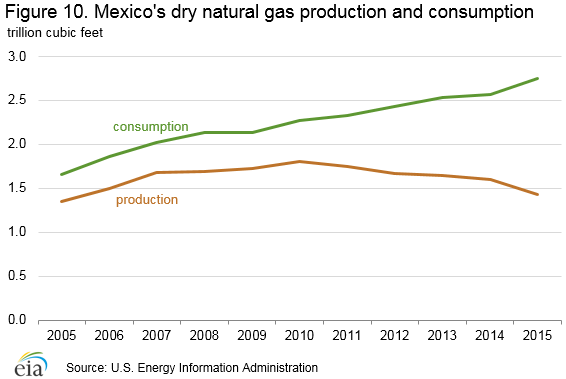
Since 2011, Mexican gas production fell 26% from 46.9 billion cubic meters (bcm) to 34.6 bcm last year. Cheap U.S. gas lies in perfect proximity to fulfill this shortfall, driving a secular rise in gas exports from the U.S. to Mexico:
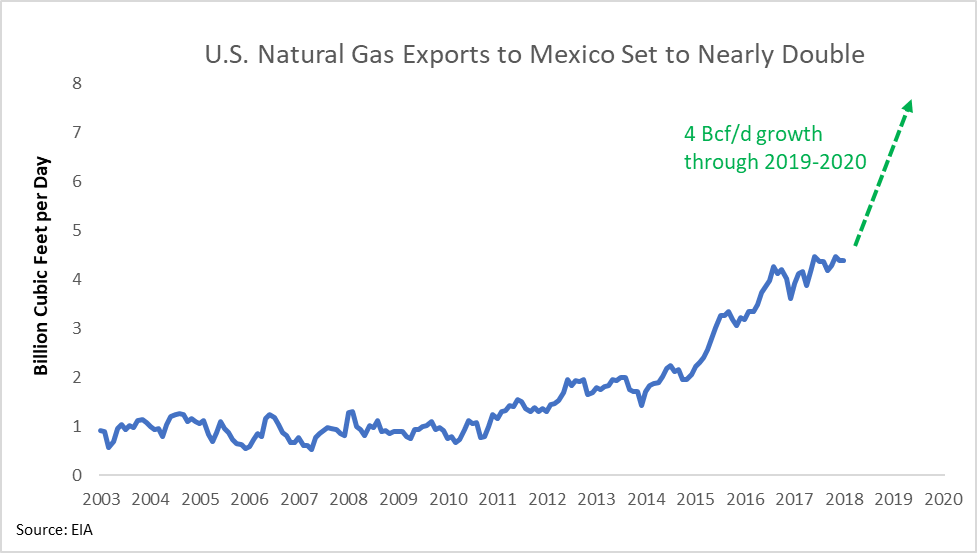
Over the next two years, U.S. pipeline gas exports will surge beyond the current rate of 4.4 billion cubic feet per day. Four pipelines including the Roadrunner, Comanche Trail, Presidio Crossing, Nueva Era, will add 3.5 Bcf/d in total capacity. Plus, the Mier-Monterrey and Nueces-Brownsville, will add another 3.3 Bcf/d in combined capacity, according to the EIA. Back in December of 2016, it looked like many of these pipelines would already be online, which would fuel a near doubling of pipeline capacity through the end of 2019:
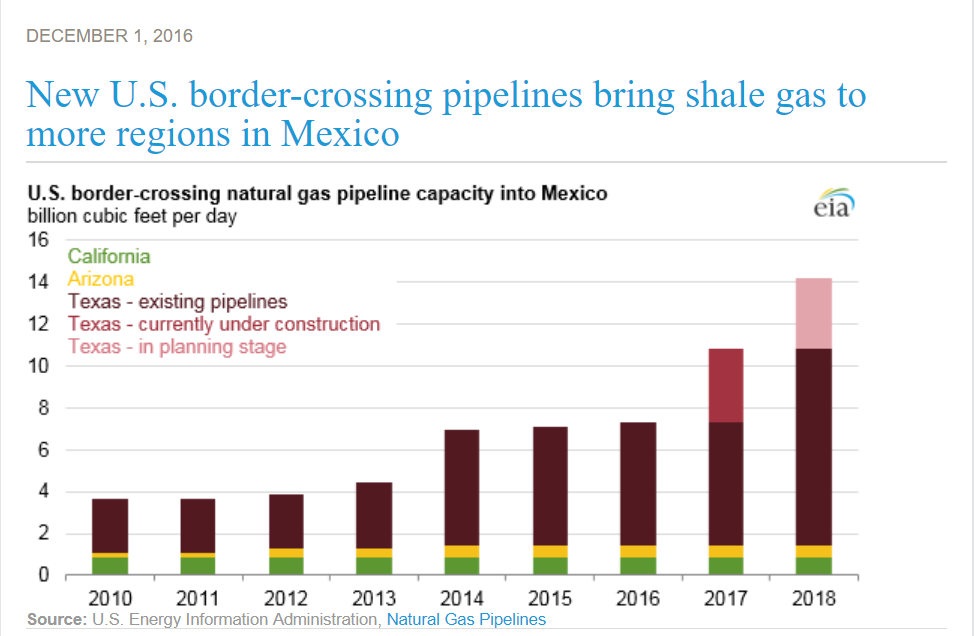
However, many of these pipelines have faced delays from environmental activists, slowing their progress. That’s why U.S. pipeline gas exports to Mexico have flatlined from 2016 levels. But make no mistake, these environmental groups will not prevent economic progress in Mexico. They’ve only slowed its pace. Analysts currently expect nearly 4 Bcf/d of new gas flow from U.S. to Mexico to come online by the end of 2019.
At the end of the day, economics trump politics. These environmentalists have cost Mexican businesses and citizens millions of dollars per year in unnecessarily high heating/electricity costs. To plug the country’s growing gas shortfall, Mexico increasingly relies on expensive LNG imports. Gas imported by LNG costs about $5/MMBtu more than the same gas delivered by pipe from America. Ultimately, concessions will be granted and progress will proceed.
Finally, the most immediate source of new demand in 2018 will come from a wave of new gas-powered electricity power plants.
3) U.S. Gas Fired Power Plants
Listening to the mainstream financial media would have one believe that renewables will deliver a death blow to fossil fuels, of which natural gas is often lumped together alongside crude oil and coal. But underneath the hype, objective data shows that natural gas-powered electricity is growing faster than any other power source in the U.S. on an absolute basis. Sure, renewables show fast percentage growth, but that’s only because they’re coming off a small base. The EIA’s latest annual electric power report shows that natural gas remains – by far – the fastest growth sector in the U.S. electricity market:
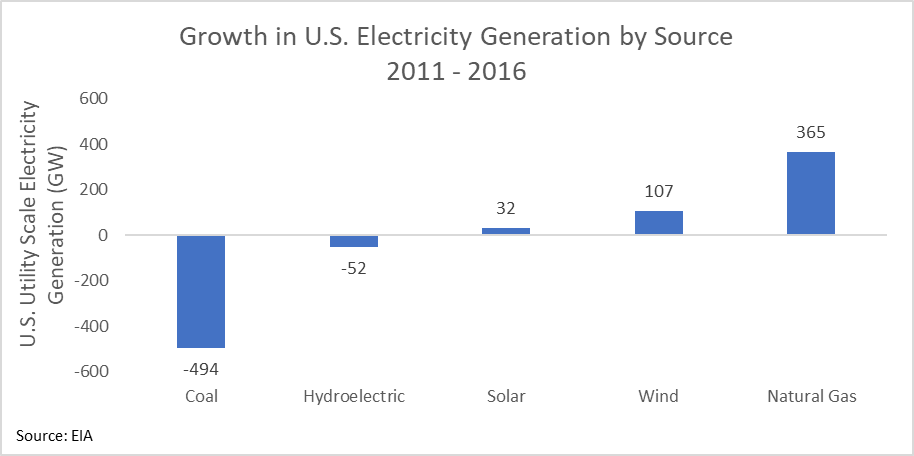
If we look at the annual market share trends, it’s easy to see that renewables are not taking market share away from natural gas. Instead, both natural gas and renewables are taking market share from coal. And within this trend, natural gas is taking market share faster than renewables:

These trends show no signs of slowing. This year, U.S. power plants will add 20 gigawatts (GW) of new gas-fired electricity capacity according to the EIA. This represents the largest annual growth rate since 2004. At the same time, 13 GW of coal-fired power plants will be retired this year. In other words, not all fossil fuels are created equal. We’re in the midst of a secular shift from coal to natural gas, not just in the U.S., but across the globe.
As a final note… another common misconception in today’s market is that the rise of electric vehicles (EVs) will deliver a death blow to fossil fuels. Here again, it’s critical to not lump all fossil fuels together. No one denies the fact that greater EV adoption will destroy demand for crude oil. But the talking heads fail to connect the following dots: all those EVs will create tremendous new demand for electricity generation. With natural gas becoming an increasingly more dominant fuel for electricity generation around the globe, the rise of EVs is categorically bullish for natural gas.
Bottom Line: Bears Looking Backwards
The bears have all fixated on one thing: backward-looking supply growth. U.S. dry gas production grew from 71.2 Bcf/d in December 2016 to 78.3 Bcf/d in December 2017. This 10.1% annual increase was the largest on record, going back to 1973. On the surface, this seems like a terrible time to bet on rising gas prices. But when you dig under the surface, all evidence points to higher prices going forward. Here’s a brief recap why…
2017’s short-term production surge was driven by high-grading, DUC drawdowns, and associated gas from rising crude oil production. These factors will begin reversing later this year and throughout 2019. In fact, we’re already seeing a slower rate of gas production growth in the data.
In 2018, the EIA estimates average daily U.S. dry gas production of 81.1 Bcf/d. This 2.8 Bcf/d increase from December 2017’s exit rate of 78.3 Bcf/d represents growth of just 3.6%. That pace of growth is more than 60% slower than last year’s rate. In 2019, growth will slow further to just 2.1%, as producers add 1.7 Bcf/d for a total of 82.8 Bcf/d. So, from the end of 2017 through the end of 2019, we can expect to add roughly 4.5 Bcf/d of average daily gas production. This deceleration in supply will run right into a wave of demand growth.
Rising domestic consumption, driven largely by 20 Gigawatts of new natural gas power plant capacity, will soak up 4.5 Bcf/d in 2018 alone. LNG exports will consume another 6 Bcf/d, rising from current levels of 3.6 Bcf/d up to 9.6 Bcf/d through 2019. At the same time, pipeline exports to Mexico will add roughly 3.5 Bcf/d of new demand.
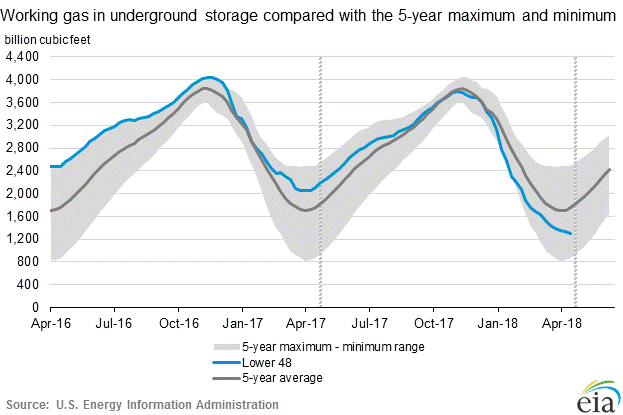
Add it all up, and we have supply growth of 4.5 Bcf/d through 2019 against demand growth of roughly 14 Bcf/d. That’s a massive supply deficit of nearly 10 Bcf/d, or more than 12% of 2019’s production. For comparison, in the crude oil market that would be like Saudi Arabia taking 100% of its production offline. And here’s the best part for the bulls…this supply mismatch will develop from already-depleted inventory levels. According to the latest EIA data through April 13th, 2018, U.S. gas inventories are 38% lower compared with this time last year, and 26% below the five-year average.
Depleted inventories plus a looming supply deficit equals higher gas prices in late 2018 and into 2019. And if we look into the early 2020s, the story gets even better. The growth in U.S. pipeline exports to Mexico combined with the rapid growth in LNG export capacity will provide a massive secular tailwind for U.S. natural gas demand for the foreseeable future. Today’s depressed share price for the companies that will satisfy this coming demand surge represent some of the most attractive investment opportunities in today’s generally overpriced financial markets.
In honor of Jim Cramer’s fear of natural gas investments, I’ve created a new acronym to play the coming boom in the sector - SCARE:
Southwestern Energy - S
Cabot Oil and Gas - C
Antero Resources - A
Range Resources - R
EQT - E
I’ll end with a prediction…
By 2020, investors capitalizing on market fear and buying SCARE companies will handily outperform the FANGS. Here's how I will track this prediction:
I'll track an equal-weighted portfolio of Southwestern Energy (SWN), Cabot Oil & Gas (COG), Antero Resources (AR), Range Resources and EQT (EQT). I'll model a 20% allocation to each of these stocks, compared against an equal-weighted portfolio of the FANGs - Facebook, Amazon (AMZN), Netflix (NFLX) and Alphabet (GOOG) (NASDAQ:GOOGL). I'll model a 25% allocation to each. I'll begin tracking as of the publish date of this article through December 31st, 2020.