On daily chart, no sign of weakness on QQQ at all. On hourly chart, there is a technical indicator break downwards. HOWEVER, this breakdown has no obvious price action correlated in the same moving direction. So, a negative divergence generated here. Meaning, trader has no reaction when seeing a bearish signal. So, vice versa, that could mean better chance they will react on a bullish signal. Implying a pull up for next Tuesday is very likely. We will see then:)
Ok, here is what I see, technically
本文内容已被 [ Thunderpark ] 在 2017-09-01 13:27:08 编辑过。如有问题,请报告版主或论坛管理删除.
所有跟帖:
•
欢迎大师们切磋讨论!
-初进大观园-
♂
![]() (0 bytes)
()
09/01/2017 postreply
13:47:04
(0 bytes)
()
09/01/2017 postreply
13:47:04
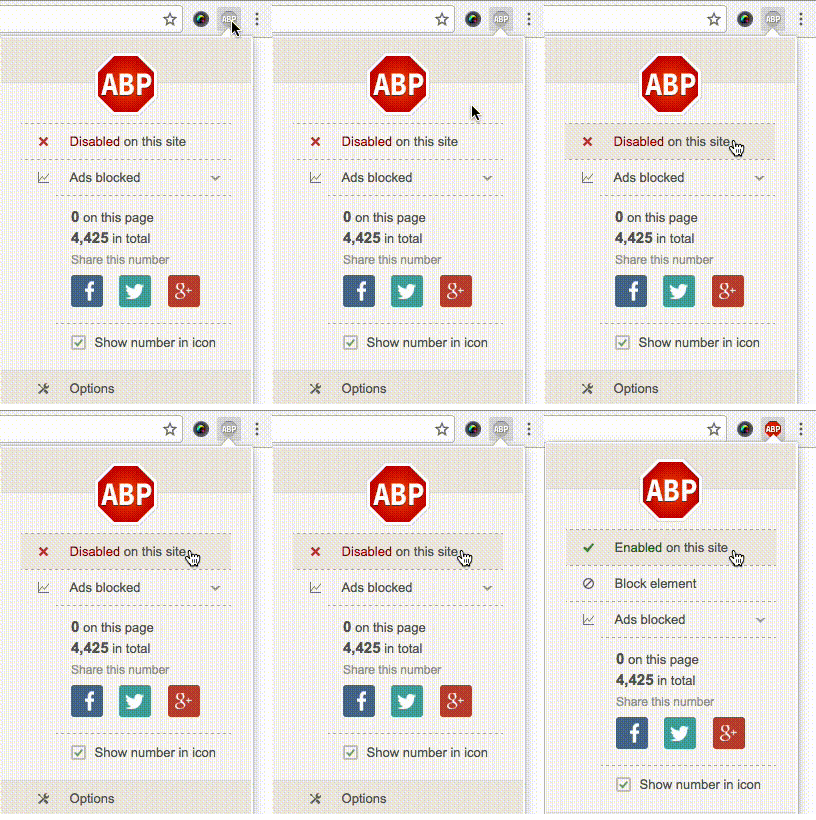
 选择“Disable on www.wenxuecity.com”
 选择“don't run on pages on this domain”

