The pattern, called ‘Golden Cross’, or ‘Bull Cross’has recently occurred on the gold charts, for only the fourth time in the past seven years. Each time it appeared during the past seven years, it precluded a strong advance.
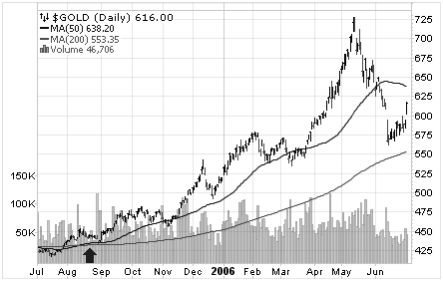
During August of 2005 the 50DMA crossed over the 200DMA for a ‘Bull Cross’. Gold was trading at $435. Nine months later gold reached $725.
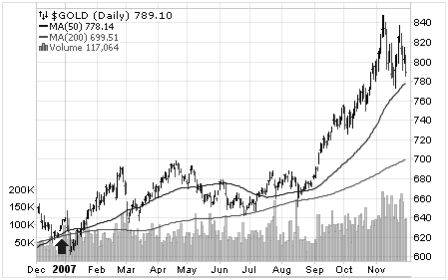
During December 2006, gold once again produced a ‘Bull Cross’. Gold was trading at $625. Eleven months later gold reached $850.
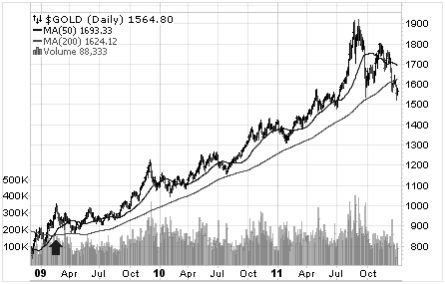
During March 2009, gold again carved out a ‘Bull Cross’. Gold was trading at $900. Thirty months later gold topped out at $1920.
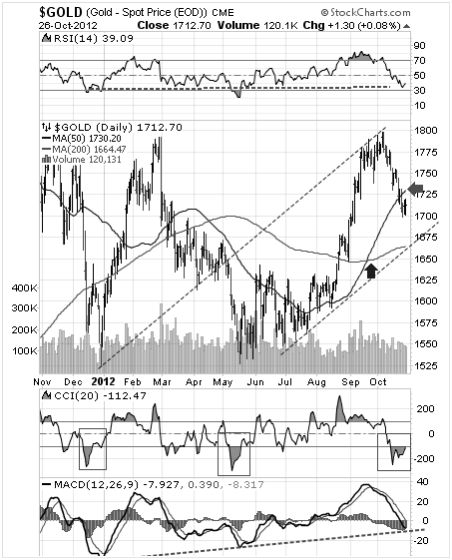
Featured is the daily gold chart. A few weeks ago the 50DMA once again moved into positive alignment with the 200DMA. How high will the gold price go this time? In order to match the 2006 advance, price could reach $2740; to match the 2007 performance gold would top out at $2640, but in the event that gold matches the performance of 2011 we could see gold trading at $3,330.
According to Mark Twain ‘history does not always repeat, but it often rhymes.'