技术分析进场,资金管理出场
1。4小时

2. 5Min
5分钟,15分钟和1小时组成的级别为超短期交易,几小时到几天
处于牛市
绿色为本级别5分钟波段:买卖点
红色为高级别15分钟波段:信号
黑色为更高级别1小时波段:方向

2. Hourly
绿色为本级别60分钟波段:买卖点
红色为高级别4小时波段:信号
黑色为更高级别日线波段:方向
1小时,4小时和日线组成的级别为中期交易,几周到几月
处于牛市:4小时1067处的空头陷阱为牛熊分解点

2011年的小时图:

下面为2011全年基于这个级别的所有交易
| Symbol | _US500 (US 500) | ||||
| Period | 1 Hour (H1) 2011.01.03 00:00 - 2011.12.23 22:59 (2011.01.01 - 2011.12.24) | ||||
| Model | Open prices only (only for Expert Advisors that explicitly control bar opening) | ||||
| Parameters | MaxLossPerTrade=0.05; MaxMarginPerTrade=0.1; takeProfitPercent=0.2; isTrendModify=false; isSellHalfWinningTrade=false; isHistoryOrderShow=true; isAllowThirdBuySell=false; sp500Future="US500.H"; crudeFuture="T.H1"; nq100Future="NQ100.H"; | ||||
| Bars in test | 6787 | Ticks modelled | 12570 | Modelling quality | n/a |
| Mismatched charts errors | 0 | ||||
| Initial deposit | 10000.00 | ||||
| Total net profit | 4073.75 | Gross profit | 5125.00 | Gross loss | -1051.25 |
| Profit factor | 4.88 | Expected payoff | 581.96 | ||
| Absolute drawdown | 180.00 | Maximal drawdown | 1852.50 (13.64%) | Relative drawdown | 14.62% (1710.00) |
| Total trades | 7 | Short positions (won %) | 6 (33.33%) | Long positions (won %) | 1 (100.00%) |
| Profit trades (% of total) | 3 (42.86%) | Loss trades (% of total) | 4 (57.14%) | ||
| Largest | profit trade | 2100.00 | loss trade | -382.50 | |
| Average | profit trade | 1708.33 | loss trade | -262.81 | |
| Maximum | consecutive wins (profit in money) | 1 (2100.00) | consecutive losses (loss in money) | 3 (-830.00) | |
| Maximal | consecutive profit (count of wins) | 2100.00 (1) | consecutive loss (count of losses) | -830.00 (3) | |
| Average | consecutive wins | 1 | consecutive losses | 2 | |

| # | Time | Type | Order | Size | Price | S / L | T / P | Profit | Balance |
| 1 | 2011.05.11 17:00 | sell | 1 | 0.80 | 1347.25 | 1362.00 | 0.00 | ||
| 2 | 2011.06.29 00:00 | close | 1 | 0.80 | 1294.75 | 1362.00 | 0.00 | 2100.00 | 12100.00 |
| 3 | 2011.08.30 07:00 | sell | 2 | 1.00 | 1207.00 | 1212.00 | 0.00 | ||
| 4 | 2011.08.30 18:00 | s/l | 2 | 1.00 | 1212.00 | 1212.00 | 0.00 | -250.00 | 11850.00 |
| 5 | 2011.08.31 21:00 | sell | 3 | 0.20 | 1212.25 | 1232.00 | 0.00 | ||
| 6 | 2011.10.05 13:00 | buy | 4 | 0.30 | 1123.25 | 1093.00 | 0.00 | ||
| 7 | 2011.10.21 17:00 | s/l | 3 | 0.20 | 1232.00 | 1232.00 | 0.00 | -197.50 | 11652.50 |
| 8 | 2011.10.26 17:00 | sell | 5 | 0.20 | 1218.75 | 1257.00 | 0.00 | ||
| 9 | 2011.10.27 08:00 | s/l | 5 | 0.20 | 1257.00 | 1257.00 | 0.00 | -382.50 | 11270.00 |
| 10 | 2011.11.01 14:00 | close | 4 | 0.30 | 1212.00 | 1093.00 | 0.00 | 1331.25 | 12601.25 |
| 11 | 2011.11.08 08:00 | sell | 6 | 0.30 | 1252.25 | 1267.00 | 0.00 | ||
| 12 | 2011.11.08 14:00 | s/l | 6 | 0.30 | 1267.00 | 1267.00 | 0.00 | -221.25 | 12380.00 |
| 13 | 2011.11.09 09:00 | sell | 7 | 0.50 | 1266.75 | 1277.00 | 0.00 | ||
| 14 | 2011.11.29 07:00 | close | 7 | 0.50 | 1199.00 | 1277.00 | 0.00 | 1693.75 | 14073.75 |
3. 15Min
15分钟,1小时和4小时组成的级别为短期交易,几天到几周
处于牛市
绿色为本级别15分钟波段:买卖点
红色为高级别60分钟波段:信号
黑色为更高级别4小时波段:方向


4. 5Min
5分钟,15分钟和1小时组成的级别为超短期交易,几小时到几天
处于牛市
绿色为本级别5分钟波段
红色为高级别15分钟波段
黑色为更高级别1小时波段

2011/12/23

15分钟一段强力拉升

空在 1254,4个连续的红手指。
大盘(图)回调接近尾声,买入信号出现

| Symbol | _US500 (US 500) | ||||
| Period | 15 Minutes (M15) 2011.10.04 00:00 - 2011.12.23 22:14 (2011.10.04 - 2011.12.24) | ||||
| Model | Open prices only (only for Expert Advisors that explicitly control bar opening) | ||||
| Parameters | MaxLossPerTrade=0.05; MaxMarginPerTrade=0.1; takeProfitPercent=0.1; isTrendModify=true; isSellHalfWinningTrade=false; isHistoryOrderShow=true; isAllowThirdBuySell=false; sp500Future="US500.H"; crudeFuture="T.H1"; nq100Future="NQ100.H"; | ||||
| Bars in test | 6403 | Ticks modelled | 11803 | Modelling quality | n/a |
| Mismatched charts errors | 0 | ||||
| Initial deposit | 10000.00 | ||||
| Total net profit | 10445.00 | Gross profit | 15327.50 | Gross loss | -4882.50 |
| Profit factor | 3.14 | Expected payoff | 652.81 | ||
| Absolute drawdown | 531.25 | Maximal drawdown | 1848.75 (10.43%) | Relative drawdown | 11.49% (1818.75) |
| Total trades | 16 | Short positions (won %) | 8 (37.50%) | Long positions (won %) | 8 (37.50%) |
| Profit trades (% of total) | 6 (37.50%) | Loss trades (% of total) | 10 (62.50%) | ||
| Largest | profit trade | 4995.00 | loss trade | -641.25 | |
| Average | profit trade | 2554.58 | loss trade | -488.25 | |
| Maximum | consecutive wins (profit in money) | 3 (7110.00) | consecutive losses (loss in money) | 5 (-2701.25) | |
| Maximal | consecutive profit (count of wins) | 7110.00 (3) | consecutive loss (count of losses) | -2701.25 (5) | |
| Average | consecutive wins | 2 | consecutive losses | 3 | |

| # | Time | Type | Order | Size | Price | S / L | T / P | Profit | Balance |
| 1 | 2011.10.04 03:30 | buy | 1 | 0.50 | 1088.25 | 1073.00 | 0.00 | ||
| 2 | 2011.10.04 14:00 | s/l | 1 | 0.50 | 1073.00 | 1073.00 | 0.00 | -381.25 | 9618.75 |
| 3 | 2011.10.04 15:45 | buy | 2 | 0.60 | 1076.50 | 1063.00 | 0.00 | ||
| 4 | 2011.10.12 14:00 | sell | 3 | 0.80 | 1197.50 | 1207.00 | 0.00 | ||
| 5 | 2011.10.12 16:30 | s/l | 3 | 0.80 | 1207.00 | 1207.00 | 0.00 | -380.00 | 9238.75 |
| 6 | 2011.10.12 22:00 | sell | 4 | 0.30 | 1201.50 | 1222.00 | 0.00 | ||
| 7 | 2011.10.17 00:15 | s/l | 4 | 0.30 | 1222.00 | 1222.00 | 0.00 | -307.50 | 8931.25 |
| 8 | 2011.10.17 08:30 | sell | 5 | 0.80 | 1222.75 | 1232.00 | 0.00 | ||
| 9 | 2011.10.18 17:45 | close | 5 | 0.80 | 1207.00 | 1232.00 | 0.00 | 630.00 | 9561.25 |
| 10 | 2011.10.31 21:45 | close | 2 | 0.60 | 1243.00 | 1063.00 | 0.00 | 4995.00 | 14556.25 |
| 11 | 2011.11.03 10:00 | buy | 6 | 0.30 | 1226.25 | 1203.00 | 0.00 | ||
| 12 | 2011.11.08 01:45 | sell | 7 | 1.10 | 1257.00 | 1267.00 | 0.00 | ||
| 13 | 2011.11.08 14:00 | s/l | 7 | 1.10 | 1267.00 | 1267.00 | 0.00 | -550.00 | 14006.25 |
| 14 | 2011.11.08 15:45 | sell | 8 | 1.50 | 1264.50 | 1272.00 | 0.00 | ||
| 15 | 2011.11.08 21:30 | s/l | 8 | 1.50 | 1272.00 | 1272.00 | 0.00 | -562.50 | 13443.75 |
| 16 | 2011.11.09 04:15 | sell | 9 | 1.70 | 1270.75 | 1277.00 | 0.00 | ||
| 17 | 2011.11.10 10:45 | close | 9 | 1.70 | 1240.25 | 1277.00 | 0.00 | 2592.50 | 16036.25 |
| 18 | 2011.11.11 18:45 | sell | 10 | 1.90 | 1260.25 | 1267.00 | 0.00 | ||
| 19 | 2011.11.14 00:15 | s/l | 10 | 1.90 | 1267.00 | 1267.00 | 0.00 | -641.25 | 15395.00 |
| 20 | 2011.11.14 09:45 | sell | 11 | 1.00 | 1264.75 | 1277.00 | 0.00 | ||
| 21 | 2011.11.21 00:15 | s/l | 6 | 0.30 | 1203.00 | 1203.00 | 0.00 | -348.75 | 15046.25 |
| 22 | 2011.11.21 19:15 | buy | 12 | 0.80 | 1187.50 | 1173.00 | 0.00 | ||
| 23 | 2011.11.23 02:15 | s/l | 12 | 0.80 | 1173.00 | 1173.00 | 0.00 | -580.00 | 14466.25 |
| 24 | 2011.11.23 09:15 | buy | 13 | 0.80 | 1172.50 | 1158.00 | 0.00 | ||
| 25 | 2011.11.24 15:45 | s/l | 13 | 0.80 | 1158.00 | 1158.00 | 0.00 | -580.00 | 13886.25 |
| 26 | 2011.11.24 17:15 | buy | 14 | 0.70 | 1163.75 | 1148.00 | 0.00 | ||
| 27 | 2011.11.25 10:15 | s/l | 14 | 0.70 | 1148.00 | 1148.00 | 0.00 | -551.25 | 13335.00 |
| 28 | 2011.11.25 15:00 | buy | 15 | 0.60 | 1156.25 | 1138.00 | 0.00 | ||
| 29 | 2011.11.28 10:00 | close | 11 | 1.00 | 1184.25 | 1277.00 | 0.00 | 4025.00 | 17360.00 |
| 30 | 2011.12.14 16:00 | close | 15 | 0.60 | 1212.00 | 1138.00 | 0.00 | 1672.50 | 19032.50 |
| 31 | 2011.12.20 00:30 | buy | 16 | 0.50 | 1202.75 | 1188.00 | 0.00 | ||
| 32 | 2011.12.23 22:14 | close at stop | 16 | 0.50 | 1259.25 | 1188.00 | 0.00 | 1412.50 | 20445.00 |
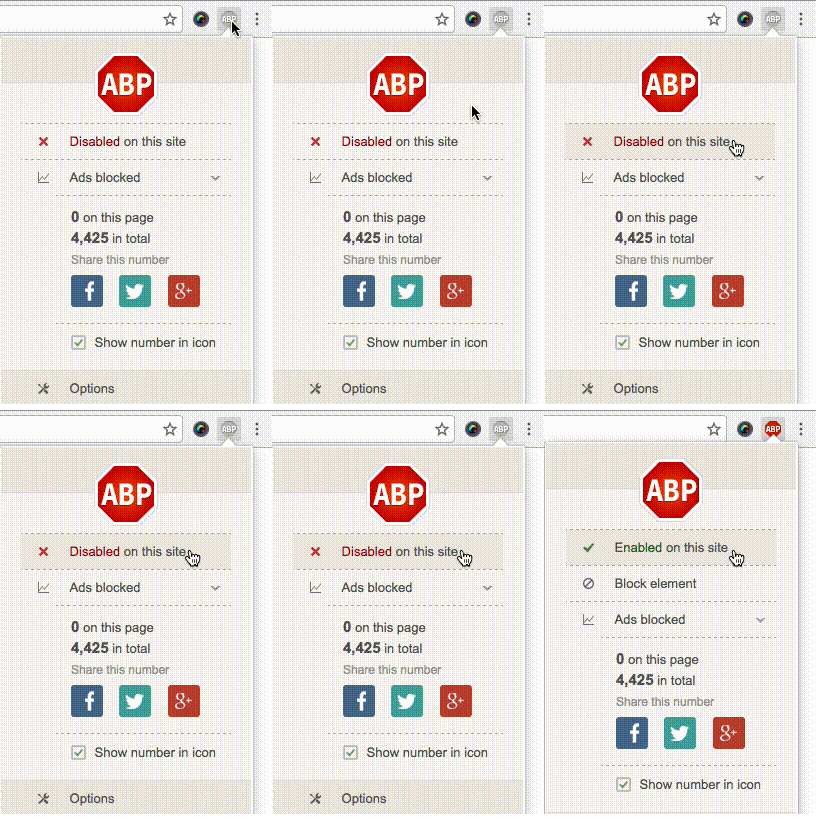
 选择“Disable on www.wenxuecity.com”
 选择“don't run on pages on this domain”

