https://medschool.duke.edu/education/health-professions-education-programs/doctor-medicine-md-program/admissions/admissions-5
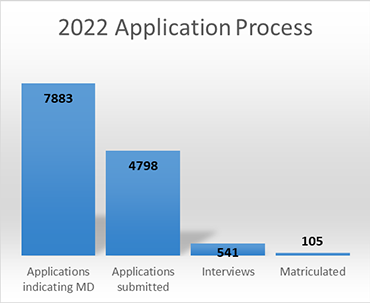
Number of Applicants
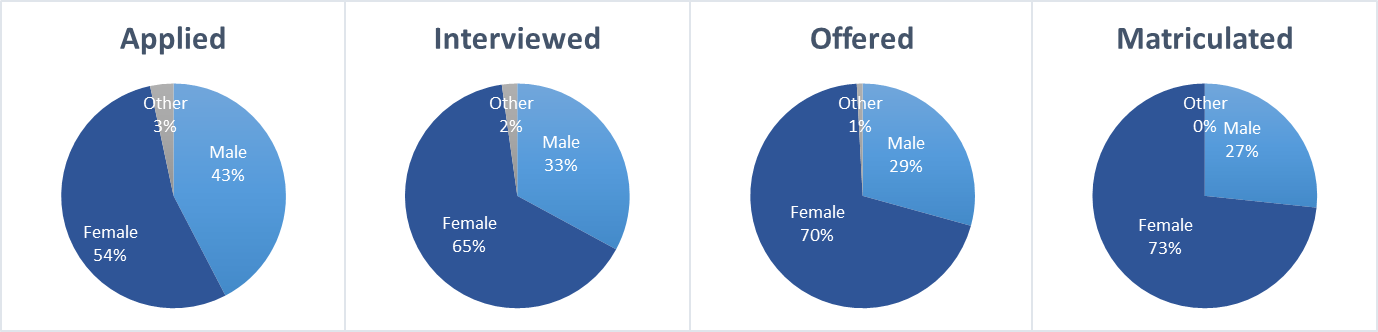
Gender Representation of Applicants
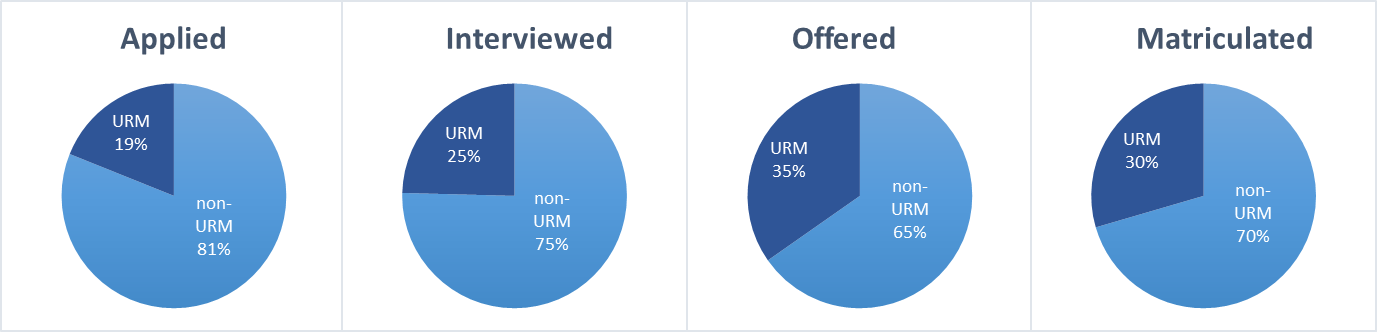
URM Representation of Applicants
MCAT & GPA Distribution of Applicants
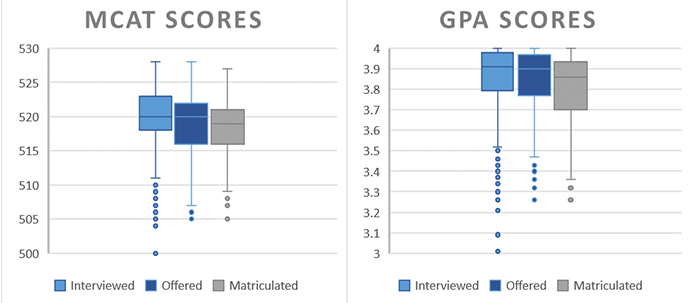
Outer lines/tails and dots indicate max & min scores of group, colored boxes (light blue, dark blue, grey) indicate middle 50% of scores, and line through colored box indicates median score of group.
 选择“Disable on www.wenxuecity.com”
 选择“don't run on pages on this domain”

