Trendlines Indicate Possible Resumption in Gold Accumulation
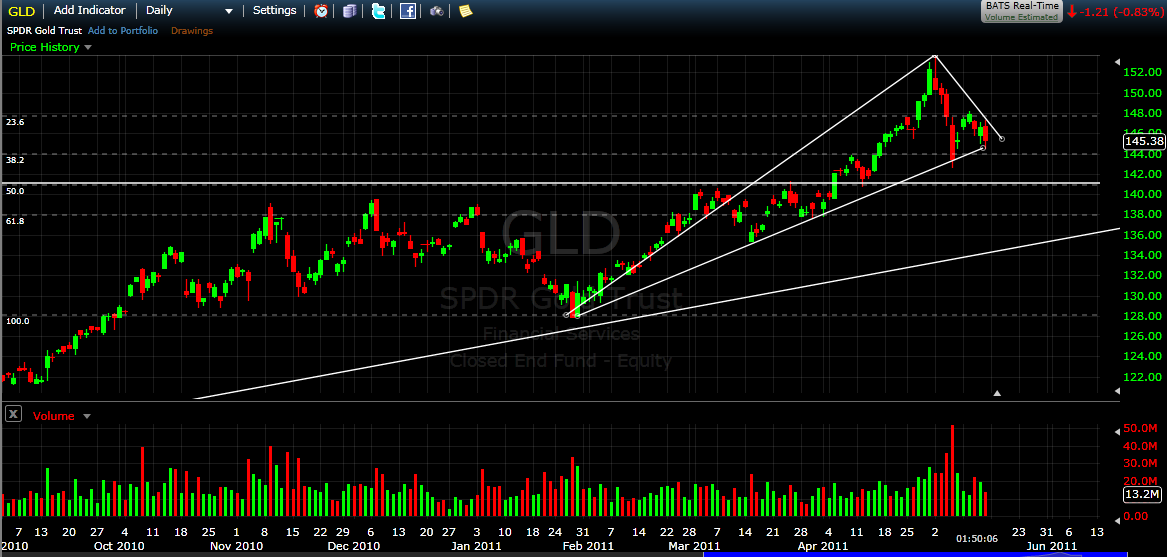
Trendlines are one of my favorite simple tools. Notice the trendline, and notice the long wicks repeatedly bouncing off them (more visible on a daily spot gold chart than on the GLD chart below). As trendlines "defend" themselves more frequently, more traders jump on, making them stronger -- thus decreasing the likelihood they will be broken (and increasing the significance if they are).
We also see this would put us at the 38.2% Fibonacci level.
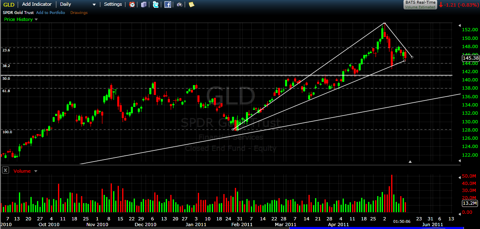
I'm always concerned about data integrity issues with volume, especially in a global market like gold in which many large participants work so diligently upon removing their tracks. In the gold market anonymity and privacy are desired by the biggest players (as gold is a way of hiding one's wealth). But I think perhaps the GLD volume high set on gold's recent top above $1578 signals a short-term selling exhaustion and the resumption of an accumulation at the trendline/Fibonacci confluence level circa 1475.
In terms of sentiment, the global sovereign debt crisis still appears to loom, moving from country to country. The World Gold Council reported central bankers were continuing to accumulate. I think this suggests the desire for an end to the current international monetary agreement and the establishment of a new one is growing stronger. And fundamentally, the global sovereign debt crisis continues, migrating from one country to another. I expect the situation to get more volatile this summer, as QE2 ends in the United States and the ECB makes additional rate decisions.
Disclosure: I am long GLD.
We also see this would put us at the 38.2% Fibonacci level.
I'm always concerned about data integrity issues with volume, especially in a global market like gold in which many large participants work so diligently upon removing their tracks. In the gold market anonymity and privacy are desired by the biggest players (as gold is a way of hiding one's wealth). But I think perhaps the GLD volume high set on gold's recent top above $1578 signals a short-term selling exhaustion and the resumption of an accumulation at the trendline/Fibonacci confluence level circa 1475.
In terms of sentiment, the global sovereign debt crisis still appears to loom, moving from country to country. The World Gold Council reported central bankers were continuing to accumulate. I think this suggests the desire for an end to the current international monetary agreement and the establishment of a new one is growing stronger. And fundamentally, the global sovereign debt crisis continues, migrating from one country to another. I expect the situation to get more volatile this summer, as QE2 ends in the United States and the ECB makes additional rate decisions.
Disclosure: I am long GLD.