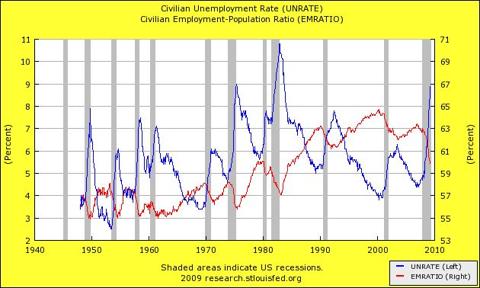
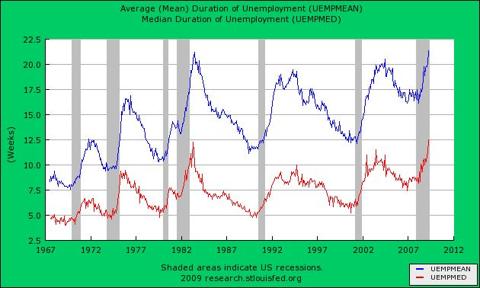
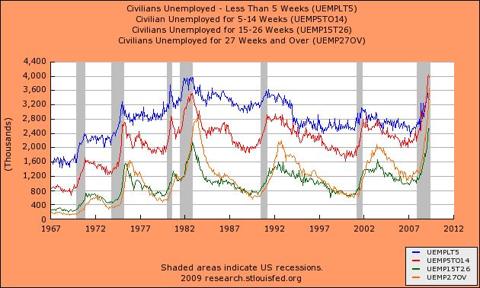
http://seekingalpha.com/article/137144-a-closer-look-at-the-unemployment-numbers?source=article_*****_picks The employment report for April was by and large treated as good news by the market, since "only" 539,000 jobs were lost in the month, and there were fears that it could have been much worse. However, having had a weekend to reflect on the news, let's dig a little deeper into the employment situation. In the yellow graph, I plot the unemployment along with the employment to population ratio, which one could think of as the employment rate. The two will of course not add to 100%, unless we seriously repeal the child labor laws and get all those lazy 3-year-olds bringing home a W-2. However, in many respects, the employment rate is just as important as the unemployment rate. Ultimately, it is incumbent on those working to support those who are not, and the higher the percentage of the population that is working, the easier it is to support those who are not. As one would expect, the employment rate and the unemployment rate are negatively correlated, but far from perfectly. During the post-war period, the unemployment rate has been volatile, but there has been no real long-term trend to it. In contrast, there was a secular rise in the employment rate, starting in the early 1960's until the end of the century. That secular rise was due to seeing the words "women" and "labor" meaning something more than childbirth. However, the recovery after the 2001 recession did not bring the employment rate back to anything close to the previous peak. The current recession has caused the employment rate to fall off a cliff. Declines are normal during a recession, but this is one of the largest ones on record. Note that until the 1991 recession, the unemployment rate would fall and the employment rate would rise almost exactly at the end of the recession. The last two recessions have been very different in this regard, with the employment situation deteriorating for more than a year past the end of the recession. While there are some tentative signs that the current recession might be coming to an end, I would not expect a quick improvement in the jobs picture. [click to enlarge] In the green graph, we look at not just the rates of unemployment (and employment) but at the length of time people are out of work. Note that in the good times, the length of time that those who lose their jobs are out of work tends to fall, but with each passing recovery, it ends up at a higher low. The decline does not start right away though, and the length of the delay in starting the decline seems to be increasing with each economic cycle. This was particularly acute in the last recovery, particularly when measured by the average (mean) length of time people were out of work. Also note that both the mean and the median length of unemployment are now at all-time records, and the recession is not over yet (as far as we know). The lengthening of the mean unemployment duration was particularly acute in the April report, jumping 1.3 weeks versus just 0.3 weeks in March, unchanged in February and up just 0.1 week in January. The median showed a similar pattern. What this suggests to me is that while the pace of layoffs may have slowed, so has the pace of new hiring. To me, the most convincing "green shoot" I have seen so far is the downturn on the four-week average of new unemployment claims. Fewer layoffs and fewer new hires would be consistent with this. [click to enlarge] So where is this rapid increase in the length of unemployment coming from? The orange graph breaks out the unemployed by duration of unemployment going back to 1967. Note that the very short-term unemployed -- those who just got their pink slips and have been out of work for less than five weeks (blue line) -- actually fell in April. Almost always, this makes up the single biggest group of the unemployed. The system needs some people to be unemployed at any given time, but if those people are only out of work for a few weeks, it does not cause any great hardship. Note that the absolute level of short-term unemployed today is at levels that would have been considered normal from the late 1970's through the mid 1990's. (Population has grown significantly since then as well.) It is the other groups of unemployed that are of more concern. Most notable is the increase in the number of people who have been unemployed for more than 27 weeks. While the extension of unemployment benefits in the stimulus bill helps somewhat, we are now looking at an unprecedented number of people who are going to be in severe financial distress due to lack of work. For the first time on record, the number of long-term unemployed has topped the number of short-term unemployed. Indeed, since 1948, the ratio of short-term to long-term unemployed has only fallen below 2.0 19% of the time. Its long-term average is 4.5, although that is skewed by very high values back in the 1950's and 1960's (not shown on the graph). Since 1980, it has averaged 2.7, and has been below 2.0 35.5% of the time. [click to enlarge] Generally when someone becomes unemployed, there is an immediate decrease in their spending. Some of this is simply because the person is no longer spending on work-related expenses, such as commuting and eating lunch in restaurants (usually low end). If the person thinks that the period of joblessness will be brief, he or she will continue with many ongoing expenses. Why quit the country club if you will be back working in a month? Use the time to lower your handicap instead! Why drop HBO from your cable service when now you actually have a chance to watch it? However, as the length of time one is out of work drags on, more and more of those non-essential expenses have to drop by the wayside. Unemployment benefits generally cover only about 60% of what people were taking in while they were on the job. So people have to draw down on their savings to get by. Given the abysmally low savings rate over the last 15 years or so, most deplete their savings rather quickly. In the past, they might have lived off the equity in their houses by refinancing or taking out home equity lines. Given the state of the housing market, that is not a realistic option for them at this point. Out of work and underwater on their home is the rather uncomfortable place that millions of Americans now find themselves. Instead they will run up their credit cards, not to buy frivolous things, but simply to keep the lights on. If unemployment drags on, the credit cards get maxed out and the card holder will have no realistic way of paying them down. Given that in recent business cycles the number of long-term unemployed has risen well past the end of the recession -- and even more so than shorter term unemployment -- there are going to be many people with no income at all coming in. The unemployment benefits have not been extended forever. This will lead to massive waves of defaults on credit cards. In part, this was recognized by the expected losses under the "more adverse" stress test scenario. For example, losses at American Express (AXP) were modeled to show a 20.2% loss rate on its credit card book, while at Capital One (COF) losses were expected to go as high as 18.2%, and at Wells Fargo (WFC) they were modeled to go as high as 26.0% of loans outstanding. In light of the extreme lengthening of the duration of unemployment, such high loss rates certainly seem well founded, if perhaps a touch on the optimistic side.