A Chart for Gold
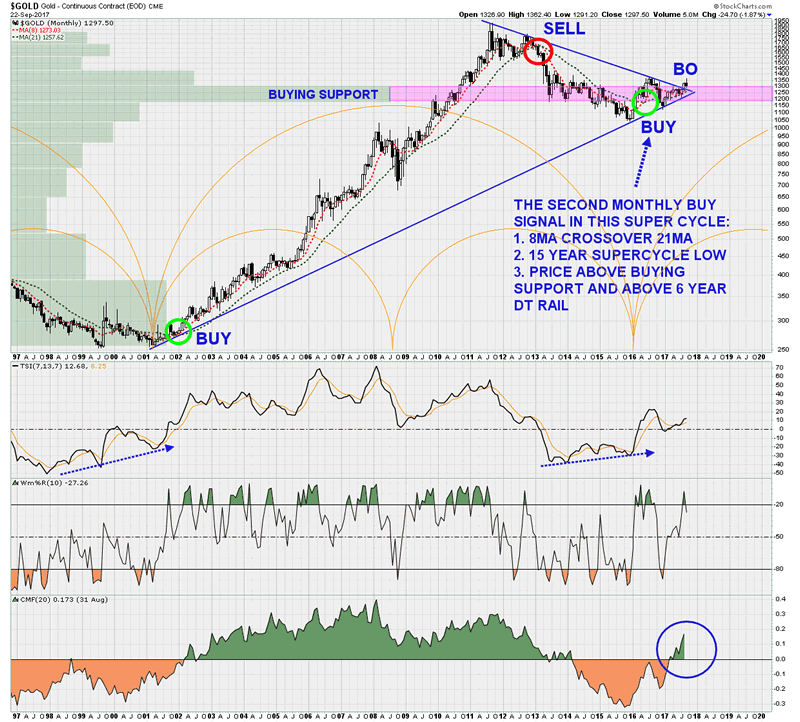
This is a monthly chart, using the 8 and 21 simple moving averages to generate the BUY and SELL signals. 8 and 21 are Fibonacci numbers.
There are only two BUY signals on this chart: 2001 and 2016, 15 years apart. The last SELL signal was in late 2012 for $GOLD. Do not expect the next SELL signal until at least 2026/27, 10 years from now, two thirds of the way into this new 15 year super cycle.
WENXUECITY.COM does not represent or guarantee the truthfulness, accuracy, or reliability of any of communications posted by other users.
Copyright ©1998-2025 wenxuecity.com All rights reserved. Privacy Statement & Terms of Use & User Privacy Protection Policy