David Fish's lists of Dividend Champions, Contenders, and Challengers.
http://www.dripinvesting.org
只知道名字也没太多实际意义。下面有个Medical Professional 谈如何管理自己的投资,可以参考。
http://seekingalpha.com/author/the-part-time-investor/articles#regular_articles
Summary
A successful DGI portfolio can be created using very simple criteria.
Just a couple of hours every quarter is all that is necessary to manage a well-designed DGI portfolio.
My K.I.S.S. portfolio continues to provide acceptable (to me) dividend growth, and it has already made up for its under performance from last year in terms of total return.
I always try to start each of my updates with a theme of what I have learned while managing my portfolio this past quarter. But this quarter has simply reiterated to me the same thing I pointed out in my last update, the benefits of patience. So I will start this article with the same introduction I started my previous one. I hope you don't mind.
In my opinion, one of the most important qualities a person must have to be a successful dividend growth investor is patience. DGI is not a get rich quick scheme. There will be good times and bad times and I know I'll have my share (my homage to Led Zeppelin), but overall, if an INVESTOR stays with it, the end results will be excellent. I highlighted INVESTOR to make a point. DGIers are INVESTORS, not traders. We must have a long-term view.
As I discussed in previous update, 2015 was a tough year for my K.I.S.S. portfolio. I entered 2015 over-weighted with energy stocks, and the weakness of the whole sector through 2015 significantly affected my overall portfolio returns. I trailed the S&P 500, as measured by the SPDR S&P 500 Trust ETF ( SPY), and the other dividend benchmarks I use, the SPDR Dividend ETF ( SDY) and the Vanguard Dividend Growth Fund ( VDIGX), in terms of total return throughout the year. But in 2016 those energy stocks have turned around and my portfolio is enjoying the rebound. I'll discuss my specific returns later on but for now I'll say that what has happened so far this year shows how patience can be rewarded. I didn't panic and sell just because certain stocks were falling. As long as the dividends continued to increase, or at least stayed the same, I continued to own them, and even in some cases buy more. And as my results this year show I am already reaping the benefits.
Still, I will remind everyone that my portfolio is a dividend growth portfolio and that my main consideration is dividend income, not price appreciation. And by this metric as well it continues to perform very well. Dividend income is my ultimate goal and it is this income that will support me in retirement. But now I can show, once again, that a straight-forward dividend growth portfolio can produce market beating results.
So, without further ado, allow me to present my 2016 third-quarter portfolio update, and the details of my K.I.S.S. portfolio's performance.
Review of Third-Quarter Contributions and Dividends
These are the total dividends I received over the past three months and the comparison (in parenthesis) to the same months during 2015:
July: $2,473.53 ($1,832.43) (+34.98%)
Aug: $4,327.91 ($3,467.79) (+24.80%)
Sept: $4,595.53 ($3,842.96) (+19.58%)
Total dividends collected in the fourth quarter: $11,396.97, an increase of 24.65% over the second quarter of last year. This includes $2,052.42 that was immediately reinvested in certain stocks through the DRIP program as shown below. $9,344.55 was held in cash for future investments.
Total fourth-quarter 401K contributions added to the account, including catch-up contributions: $28,000. (This was larger than usual because the second quarter contribution came in late, so two contributions were received during this one quarter.)
Including cash left over from the previous quarter, the total funds available for investment this past quarter was $38,330.
The K.I.S.S. System
Over the past three years, I have been developing and refining my Keep It Simple, Stupid (K.I.S.S.) system for creating a dividend growth portfolio. The system I developed has been discussed in my previous updates, but as a quick summary, my criteria for buying stocks are as follows:
For Purchase of Regular stocks
- The stock is on the Dividend Champions, Contenders and Challengers [CCC] list (as compiled by David Fish)
- The payout ratio < 60%
- For stocks with a yield between 2.0 and 2.5%, the Chowder Number (Dividend yield + 5-yr dividend growth rate) >16
- For stocks with a yield between 2.5 and 3.0%, the Chowder Number (Dividend yield + 5-yr dividend growth rate) >14
- For stocks with a yield greater than 3.0%, the Chowder Number (Dividend yield + 5-yr dividend growth rate) >12
- A Quality Rating of A- or better from S&P
- F.A.S.T. Graph shows a 10-year uptrend in earnings; F.A.S.T. Graph shows that the stock is not overvalued.
The use of different Chowder Number requirements is a change I made to my criteria over the past year. I prefer to have stocks with higher yields, but if the rest of the story is compelling enough I am willing to buy stocks with yields in the 2.0% to 3.0% range if their DGRs and Chowder Numbers are higher, as shown in my criteria above. Please see the previous article I wrote about different yields, DGRs and Chowder Numbers to read about my thinking on this topic.
For Purchase of MLPs, REITs, Utilities and Telecoms (High Yielders)
- The stock is on CCC list
- Yield > 4%
- Chowder Number > 8%
- DGR for all time periods (1-yr., 3-yr., 5-yr. and 10-yr.) at least 3.5%.
- F.A.S.T. Graph shows a 10-year uptrend (or for the life of the company, if less than 10 years) in funds from operations ("FFO").
- F.A.S.T. Graph shows that the stock is not overvalued based on its FFO.
The time it takes to run this screen is only about 1-2 hours per quarter, since most of the work has already been done for us by David Fish (the CCC list), Chuck Carnevale (FAST Graphs) and S&P (The S&P Quality rankings).
My criteria for selling a stock are also very simple. I will only sell if the stock cuts its dividend. I do not look at anything else when deciding whether or not to sell. Therefore the only other work that needs to be done during the quarter is to watch for the dividend announcement from each company, and put in a sell order if there is a dividend cut.
Sales
None
I must take a moment at this point to discuss Plains All-American (NYSE:PAA). PAA, which cut its dividend recently by 21.4%. As mentioned above I have a rule that says I will sell any stock that cuts its dividend. But I should clarify that statement by saying that that is only for my stocks that I consider to be DGI stocks. Instead PAA is one of my high yield stocks, made up of quality companies that have been paying a high yield for a long period of time (so which most likely are relatively safe), and which I use to bring in a significant amount of dividend income which is then used to reinvest in other stocks. After the cut PAA still pays a healthy 7.00% yield, so I'm still going to hold on to it.
Purchases
After running my screen about 20 stocks passed my criteria. But none of these stocks were compelling enough to me to add as a new position. Instead I chose to use my PAAY system to reinvest my available funds into the stocks in my portfolio which were most undervalued.
PAAY and Reinvesting
Since I made no new purchases I reinvested all of my available cash into some of the stocks I already own. When reinvesting I put my available cash, not back into the stocks that paid the dividend, but instead into more shares of my most undervalued positions. This is where my "Percent Above Average Yield" (PAAY) system comes in. (I discussed how I use PAAY in a previous
article). Please note that I use PAAY only to rank the companies already in my portfolio for purposes of reinvesting my dividends, not for new purchases (it would be too difficult to calculate the PAAY for all stocks under consideration for purchase).
This quarter, the following companies were highest-ranking stocks in my portfolio ranked by PAAY, and therefore, the most undervalued (in alphabetical order): Ameriprise Financial (AMP), Boeing (BA), Cracker Barrel (NASDAQ:CBRL), Darden Inc.(NYSE:DRI), General Electric (NYSE:GE), Hasbro (NASDAQ:HAS), McDonald's (NYSE:MCD), Target (TGT), T. Rowe Price (TROW) and Wells Fargo (WFC). Actually Lockheed Martin (NYSE:LMT) was one of the top 10 PAAY Stocks, but I already own a over-weighted position in LMT, so I chose not to buy anymore, and instead went with the #11 ranked stock, GE.
Therefore, I used my available funds to buy the following amount of these 10 stocks:
|
STOCK |
SHARES |
PRICE |
COMM |
COST |
|
AMP |
37 |
102.87 |
$1.11 |
$3,807.30 |
|
BA |
29 |
134.22 |
$0.87 |
$3,893.25 |
|
CBRL |
29 |
132.13 |
$0.87 |
$3,832.64 |
|
DRI |
62 |
61.92 |
$1.86 |
$3,840.90 |
|
GE |
129 |
29.585 |
$3.87 |
$3,820.33 |
|
HAS |
48 |
80.64 |
$1.44 |
$3,872.16 |
|
MCD |
33 |
114.07 |
$0.99 |
$3,765.30 |
|
TGT |
56 |
68.42 |
$1.68 |
$3,833.20 |
|
TROW |
57 |
67.36 |
$1.71 |
$3,841.23 |
|
WFC |
87 |
44.84 |
$2.61 |
$3,903.69 |
I also received the following shares of stocks due to DRIP plans in my Optionsxpress account (most of my portfolio is held in a Univest account which does not offer DRIPs):
|
STOCK |
SHARES |
|
Alliance Resource Partners LP (NASDAQ:ARLP) |
23.689 |
|
Avista Corp. (NYSE:AVA) |
3.855 |
|
Chevron Corporation (NYSE:CVX) |
0.243 |
|
General Electric Company |
2.67 |
|
Annaly Capital Management, Inc. (NYSE:NLY) |
44.415 |
|
ONEOK Inc. (NYSE:OKE) |
5.168 |
|
Plains All American Pipeline, L.P. |
1.365 |
|
PIMCO Corporate & Income Fund (NYSE:PTY) |
24.413 |
|
W. P. Carey Inc. (NYSE:WPC) |
2.919 |
Following these transactions, this is the present composition of my portfolio (as of market close 10/7/16):
|
STOCK |
SHARES |
PRICE |
VALUE |
DIV/SHARE |
YIELD |
Expected Dividends |
|
Apple Inc. (NASDAQ:AAPL) |
170 |
$114.06 |
$19,390.20 |
$2.28 |
2.02% |
$387.60 |
|
Aflac Incorporated (NYSE:AFL) |
245 |
$71.38 |
$17,488.10 |
$1.64 |
2.28% |
$401.80 |
|
Ameriprise Financial, Inc. (NYSE:AMP) |
234 |
$101.16 |
$23,671.44 |
$3.00 |
2.98% |
$702.00 |
|
Air Products and Chemicals, Inc. (NYSE:APD) |
111 |
$135.08 |
$14,993.88 |
$3.44 |
2.51% |
$381.84 |
|
Avista Corp. |
559.837 |
$39.14 |
$21,912.02 |
$1.37 |
3.47% |
$766.98 |
|
The Boeing Company (NYSE:BA) |
199 |
$133.85 |
$26,636.15 |
$4.36 |
3.24% |
$867.64 |
|
Becton, Dickinson and Company (NYSE:BDX) |
137 |
$177.40 |
$24,303.80 |
$2.64 |
1.49% |
$361.68 |
|
BlackRock, Inc. (NYSE:BLK) |
40 |
$357.21 |
$14,288.40 |
$9.16 |
2.56% |
$366.40 |
|
Cracker Barrel Old Country |
212 |
$133.44 |
$28,289.28 |
$4.60 |
3.48% |
$975.20 |
|
Cincinnati Financial Corp. (NASDAQ:CINF) |
310 |
$75.17 |
$23,302.70 |
$1.92 |
2.59% |
$595.20 |
|
Cummins Inc. (NYSE:CMI) |
221 |
$128.44 |
$28,385.24 |
$4.10 |
3.15% |
$906.10 |
|
CSX Corp. (NYSE:CSX) |
709 |
$31.05 |
$22,014.45 |
$0.72 |
2.32% |
$510.48 |
|
Chevron Corporation |
171.322 |
$102.27 |
$17,521.10 |
$4.28 |
4.19% |
$733.26 |
|
Dominion Resources, Inc. (NYSE:D) |
219 |
$71.50 |
$15,658.50 |
$2.80 |
3.89% |
$613.20 |
|
Deere & Company (NYSE:DE) |
193 |
$86.30 |
$16,655.90 |
$2.40 |
2.81% |
$463.20 |
|
Digital Realty Trust Inc. (NYSE:DLR) |
281 |
$91.62 |
$25,745.22 |
$3.52 |
3.87% |
$989.12 |
|
Darden Restaurants, Inc. |
365 |
$61.63 |
$22,494.95 |
$2.24 |
3.64% |
$817.60 |
|
Emerson Electric Co. (NYSE:EMR) |
337 |
$52.70 |
$17,759.90 |
$1.90 |
3.53% |
$640.30 |
|
Four Corners Prop. Trust, Inc. (NYSE:FCPT) |
138.03 |
$20.12 |
$2,777.16 |
$0.97 |
4.87% |
$133.89 |
|
First of Long Island Corporation (NASDAQ:FLIC) |
629 |
$32.37 |
$20,360.73 |
$0.81 |
2.48% |
$509.49 |
|
General Dynamics Corporation (NYSE:GD) |
198 |
$152.96 |
$30,286.08 |
$3.04 |
1.97% |
$601.92 |
|
General Electric Company |
734.969 |
$29.08 |
$21,372.90 |
$0.92 |
3.14% |
$676.17 |
|
Hasbro Inc. |
348 |
$79.30 |
$27,596.40 |
$2.04 |
2.53% |
$709.92 |
|
Harris Corporation (NYSE:HRS) |
253 |
$92.62 |
$23,432.86 |
$2.12 |
2.31% |
$536.36 |
|
International Business Machines (NYSE:IBM) |
99 |
$155.67 |
$15,411.33 |
$5.60 |
3.57% |
$554.40 |
|
Illinois Tool Works Inc. (NYSE:ITW) |
157 |
$117.20 |
$18,400.40 |
$2.60 |
2.18% |
$408.20 |
|
Johnson & Johnson (NYSE:JNJ) |
159 |
$119.24 |
$18,959.16 |
$3.20 |
2.69% |
$508.80 |
|
L-3 Communications Holdings Inc. (NYSE:LLL) |
146 |
$151.60 |
$22,133.60 |
$2.80 |
1.86% |
$408.80 |
|
Lockheed Martin Corporation |
144 |
$233.53 |
$33,628.32 |
$6.60 |
2.79% |
$950.40 |
|
McDonald's Corp. |
161 |
$113.45 |
$18,265.45 |
$3.76 |
3.32% |
$605.36 |
|
Microsoft Corporation (NASDAQ:MSFT) |
495 |
$57.80 |
$28,611.00 |
$1.56 |
2.71% |
$772.20 |
|
National Health Investors Inc. (NYSE:NHI) |
242 |
$75.00 |
$18,150.00 |
$3.60 |
4.64% |
$871.20 |
|
Norfolk Southern Corporation (NYSE:NSC) |
174 |
$96.78 |
$16,839.72 |
$2.36 |
2.42% |
$410.64 |
|
Nu Skin Enterprises Inc. (NYSE:NUS) |
394 |
$64.66 |
$25,476.04 |
$1.42 |
2.17% |
$559.48 |
|
Novartis AG (NYSE:NVS) |
240 |
$78.29 |
$18,789.60 |
$2.72 |
3.44% |
$652.80 |
|
Realty Income Corporation (NYSE:O) |
369 |
$61.46 |
$22,678.74 |
$2.42 |
3.71% |
$892.98 |
|
Omega Healthcare Investors Inc. (NYSE:OHI) |
519 |
$33.18 |
$17,220.42 |
$2.40 |
7.20% |
$1,245.60 |
|
ONEOK Inc. |
485.023 |
$49.36 |
$23,940.74 |
$2.46 |
4.95% |
$1,193.16 |
|
Paychex, Inc. (NASDAQ:PAYX) |
438 |
$56.52 |
$24,755.76 |
$1.84 |
3.20% |
$805.92 |
|
Pepsico, Inc. (NYSE:PEP) |
162 |
$105.99 |
$17,170.38 |
$3.01 |
2.83% |
$487.62 |
|
The Procter & Gamble Company (NYSE:PG) |
166 |
$90.00 |
$14,940.00 |
$2.68 |
3.01% |
$444.88 |
|
QUALCOMM Incorporated (NASDAQ:QCOM) |
377 |
$68.19 |
$25,707.63 |
$2.12 |
3.14% |
$799.24 |
|
Raytheon Company (NYSE:RTN) |
198 |
$136.78 |
$27,082.44 |
$2.93 |
2.14% |
$580.14 |
|
Royal Bank of Canada (NYSE:RY) |
225 |
$61.62 |
$13,864.50 |
$2.57 |
4.16% |
$578.25 |
|
Southern Company (NYSE:SO) |
341 |
$49.16 |
$16,763.56 |
$2.24 |
4.18% |
$763.84 |
|
Sysco Corporation (NYSE:SYY) |
372 |
$48.07 |
$17,882.04 |
$1.24 |
2.60% |
$461.28 |
|
Target Corp. (NYSE:TGT) |
339 |
$69.04 |
$23,404.56 |
$2.40 |
3.49% |
$813.60 |
|
T. Rowe Price Group, Inc. (NASDAQ:TROW) |
311 |
$66.58 |
$20,706.38 |
$2.16 |
3.21% |
$671.76 |
|
Tupperware Brands Corporation (NYSE:TUP) |
205 |
$65.28 |
$13,382.40 |
$2.72 |
4.11% |
$557.60 |
|
UGI Corporation (NYSE:UGI) |
568 |
$43.68 |
$24,810.24 |
$0.95 |
2.15% |
$539.60 |
|
United Technologies Corporation (NYSE:UTX) |
108 |
$100.58 |
$10,862.64 |
$2.64 |
2.59% |
$285.12 |
|
Walgreen's Boots Alliance, Inc. (NASDAQ:WBA) |
229 |
$79.88 |
$18,292.52 |
$1.50 |
1.86% |
$343.50 |
|
WEC Energy Group, Inc. (NYSE:WEC) |
336 |
$57.09 |
$19,182.24 |
$1.98 |
3.46% |
$665.28 |
|
Wells Fargo & Company (NYSE:WFC) |
384 |
$45.33 |
$17,406.72 |
$1.52 |
3.36% |
$583.68 |
|
Wal-Mart Stores Inc. (NYSE:WMT) |
184 |
$68.70 |
$12,640.80 |
$2.00 |
2.88% |
$368.00 |
|
W. P. Carey Inc. |
260.008 |
$61.51 |
$15,993.09 |
$3.94 |
6.40% |
$1,024.43 |
|
Cash |
$1,026.97 |
|||||
|
HIGH YIELD NON-DGI STOCKS |
||||||
|
Alliance Resource Partners LP |
1,293.59 |
$22.25 |
$28,782.33 |
$1.75 |
7.80% |
$2,263.78 |
|
Buckeye Partners, L.P. (NYSE:BPL) |
195 |
$69.98 |
$13,646.10 |
$4.85 |
7.01% |
$945.75 |
|
Annaly Capital Management, Inc. |
1,494.73 |
$10.02 |
$14,977.21 |
$1.06 |
10.58% |
$1,584.42 |
|
Plains All American Pipeline, L.P. |
603.735 |
$31.13 |
$18,794.27 |
$2.20 |
7.00% |
$1,328.22 |
|
PIMCO Corporate & Income Fund |
1,108.72 |
$14.91 |
$16,531.06 |
$1.56 |
11.90% |
$1,729.61 |
|
Williams Partners L.P. (NYSE:WPZ) |
398 |
$36.47 |
$14,515.06 |
$3.40 |
9.32% |
$1,353.20 |
|
$1,247,962.79 |
3.58% |
$44,660.07 |
Returns
My portfolio has increased in value this first quarter from $1,190,564.34 to $1,247,962.79. When you take out the 401K contribution of $26,500 and catch-up contributions of $1,500 this comes out to a return of 2.47%. In the same time period the "market" as represented by SPY was up 2.65%. YTD my portfolio is up 18.12% while the YTD return for SPY is 7.22%
I publish these updates to show how a simple DGI portfolio can be created and managed, and to show not only that a DGI portfolio can produce a high quality stream of increasing dividends, but that it can also produce market-matching (possibly even beating) returns. But in order to get people unfamiliar with DGI to believe that DGI can be a successful way to produce total return I have to show them the results compared to what they could otherwise be doing. By showing my results compared to some common benchmarks, I can demonstrate how effective DGI can be. This is why I always show the comparisons to benchmarks.
Based on articles written and comments made on SA, I have chosen to use three different entities as my benchmarks, the SPDR S&P 500 Trust ETF, the SPDR S&P Dividend ETF and the Vanguard Dividend Growth Fund. By using these benchmarks, I can compare my portfolio to the market as a whole, to a dividend growth ETF, and to a dividend growth mutual fund. These are the indices most often mentioned on SA as the ones that DGIers should be putting their money into by those who don't believe that individuals can beat an index.
To make the comparisons accurate, I run three paper portfolios made up of each of the three indices above. For each of these portfolios, whenever I have cash contributions put into my real-life account, I also put the same amount into the paper portfolios and "buy" more shares of the individual indices. And when SPY, SDY or VDIGX pays a dividend, it gets reinvested into more paper shares, just like I reinvest my real-life dividends in my portfolio. As far as I can tell, this is the most accurate way I have to compare their performances.
This quarter the returns of my benchmarks were:
SPY 2.65%
SDY -1.50%
VDIGX -.42%
So two other dividend portfolio's run by professionals, SDY and VDIGX, are actually down this past quarter, while my self managed DGI portfolio has a positive 2.47% return.
These results show that dividend portfolios, including mine, after trailing the S&P last year, have caught back up over this year and have so far outperformed the S&P. In fact my portfolio is now beating the S&P over the life of the portfolio by a significant amount. Over the past three years and nine months, which is how long I've run the portfolio, it has produced an annual return of 13.74%. In comparison, a portfolio invested in SPY (i.e., "the market") with the same amount of contributions as were invested in my K.I.S.S. portfolio, and at the same time, would have produced a return of 11.93%. A portfolio invested the same way, but only in VDIGX would have returned 13.16%. A portfolio invested only in SDY, which prior to this quarter had the best over all return, is now producing a return of 11.06%. I already pointed out how I am beating the S&P, but now I can also show that my simple KISS portfolio is beating the dividend portfolios run by the professional portfolio managers.
Dividends
During the third quarter I collected $11,396.97 in dividends, another quarterly record for me. So far in 2016 I have collected $32,917.63 in dividends. This is 14.58% higher than the$28,728.93 I collected at this point last year. During 2015, I collected $39,567.34 in dividends. This is an increase of 34.16% over the $29,493.64 I collected in 2014. But now, with the declared dividends for each of my companies, the amount of dividends I expect to collect in the next 12 months (ED12) is $44,660.07, a 12.87% increase over what I collected in 2015. And as many of my stocks continue to increase their dividends over the coming year I expect that the dividend growth will be even higher. It is important to note that the growth in my ED12 is due both to the dividends expected from new contributions, as well as the actual organic dividend growth of the stocks in my portfolio.
The present yield of my portfolio is 3.58%. This is down somewhat from my high earlier in the year (3.99%) but mostly due to the increase in the portfolio value, not due to a drop in dividends. As shown in the following graph my dividend income continues to grow year by year.
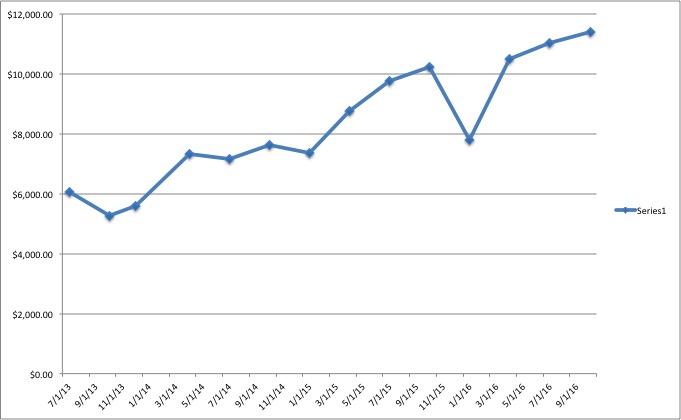
The drop three quarters ago was due to a change in the composition of my portfolio and the months when some of the companies pay their dividends. On a yearly basis the total dividends continue to increase.
Conclusion
I am not an expert on finance or investing. Most of what I know I have learned here on Seeking Alpha. If I can produce dividend income and total returns that beat the market, then anybody can. All you have to do is take the time to read about DGI from some of the best contributors here on SA (DVK, Chowder, Bob Wells, etc.), set up a system that you are comfortable with and stick to that system. And try to keep it as simple as possible. The more complicated it is the harder it is to follow, and in my opinion the worse your results will be in the end.
As I said in my last update "Every portfolio is going to have its ups and downs in terms of total return. And yet, in my case, you can see that by sticking with my dividend growth philosophy I have already made up for my underperformance from last year. There was no reason to panic. No reason to change my plan. I'm sticking with what I know will work long term and letting the magic of compounding happen. Over a period of 20-30 years I expect that the dividend growth I focus on will lead to the kind of returns I'm hoping for." And as my results over the first three quarters of 2016 show this is already happening. In fact, my results over the past almost 4 years, (when I started posting these updates) show that although as of the end of last year I was behind the S&P I am now beating the market over the time period I've had this portfolio.
As I've already said but must reiterate, the mindset of a dividend growth investor, specifically me, is to grow the dividend income produced by his (or her) portfolio, and not necessarily to focus on growing the size of the portfolio. I know this is a controversial statement to some, but it is how I look at my investing, and how I analyze my results. In the long run, by maintaining my discipline and carrying out my K.I.S.S. criteria, I believe in the end I will beat "the market". The stocks in my portfolio that performed poorly last year have already started to come back strongly, and over the next 20-30 years, as long as they continue to increase their dividends, I believe they will continue to perform well.
DGI has taught me to have a long-term focus, and for that focus to be on the dividends, not on price movement. The prices of some of my stocks may fall from time to time, but as long as the dividends continue to rise I know the stock prices will eventually recover. More importantly, while waiting for that to happen, I will continue to collect dividends from those stocks. And as the dividends increase, if the prices stay low, it will just give me even more opportunities to buy more shares of undervalued stocks. I'm already enjoying some of the benefits of my patience, as I was able to buy shares at depressed prices, which means I will collect even more dividends in the coming years.
So my plan going forward is to continue to focus on the dividends and to follow my simple K.I.S.S. rules. They have been working very well so far. I believe my results continue to support my hypothesis: That by using simple, straightforward, easy-to-understand criteria for buying and selling, and by using the hard work of other people (Thank you David Fish, Chuck Carnevale, S&P and all the wonderful SA contributors I have learned from!), that someone can achieve excellent investment results without having to put an inordinate amount of time into the process.
Thank you for reading my article. I welcome your comments and criticisms.
Disclosure: I am/we are long AMP, BA, CBRL, DRI, TGT, TROW, WFC.
I wrote this article myself, and it expresses my own opinions. I am not receiving compensation for it (other than from Seeking Alpha). I have no business relationship with any company whose stock is mentioned in this article.
 选择“Disable on www.wenxuecity.com”
 选择“don't run on pages on this domain”

