Brian Maher, January 9, 2019.
" 。 。 。
Are stocks “cheap” again?
Is it time once again to cast your bread upon the waters… and buy?
Today we rise above the daily hurly-burly of the market… take the long view… and ransack the past for clues about the future.
The major averages were negative for 2018. And the stock market has just emerged from its bleakest December since 1931.
But the market has found a toehold, bleats the consensus. The way ahead is higher. It is time to hunt bargains.
There is doubtless justice here — in specific cases and in the short run at least.
But are stocks cheap overall? And what can you expect for the next 10 years?
In general terms…
If stocks are cheap today, you can expect — generally, again — lovely returns for the following decade.
The reverse obtains if stocks are expensive today.
So once again: Are stocks presently cheap? Is it time to buy?
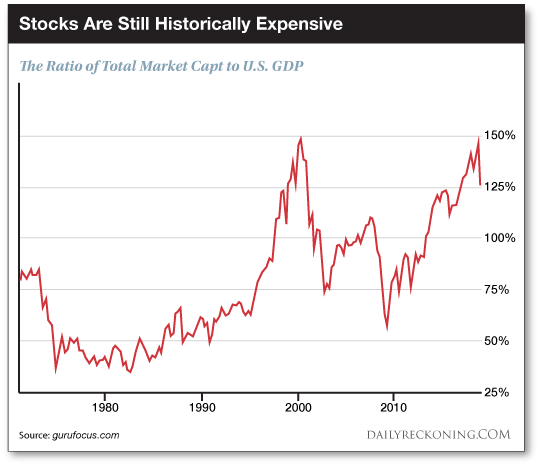
Warren Buffett’s preferred metric is the TMC/GNP ratio.
That is, the ratio of total market cap to U.S. GNP (which approximates but does not equal GDP).
If the total valuation of the stock market is less than GNP, stocks are cheap.
If it is greater than GNP… stocks are dear.
Mr. Buffett claims this formula is “probably the best single measure of where valuations stand at any given moment.”
Any ratio below 50% means stocks are “significantly undervalued.”
A ratio above 115% means they’re “significantly overvalued.”
Stretching four decades, the TMC/GNP ratio was lowest in 1982 — at 35%.
Not coincidentally, 1982 marked the onset of the lengthiest bull market of all time.
In violent contrast, the TMC/GNP ratio was highest in 2000, at 148%.
The dot-com catastrophe was close behind.
What is the TMC/GNP ratio today, Jan. 9, 2019?
127.5%.
That is, despite the worst December since 1931... by this measure stocks remain “significantly overvalued.”
What does that 127.5% imply for the stock market over the next decade, based on the historical record?
Negative 0.5% returns per year, including dividends.
You can expect negative returns for the next decade — if you take this TMC/GNP ratio as your guide.
Is it an infallible prophet?
It is not. None exists this side of eternity.
But financial journalist Mark Hulbert tracks eight market indicators he deems most credible. And he ranks it among the better of them.
But could negative 0.5% returns per year for the next decade — including dividends — actually be optimistic?
。。。