http://edgetraderplus.com/market-commentaries/gold-and-silver-elite-can-will-steal-your-cash-but-cannot-touch-your-goldsilver

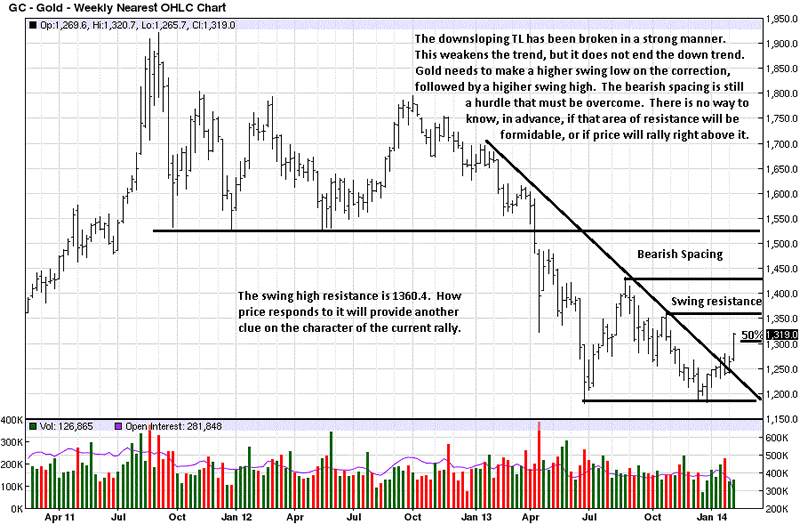
The weekly chart shows the current down trend weakening but not ending. As is pointed out in the weekly silver chart, one only need look at the rally that began in June, 2013. If anyone thought the breaking of a TL [Trend Line] meant the end of a bear market, look again. It takes time for a trend to change, and with the exception of a "V-Bottom," there are a few phases that mark trend changes.
The Bearish Spacing still stands out for what could be formidable resistance, yet to be determined. As a reminder, bearish spacing exists when the last swing high, August 2013, fails to reach the lows of the last swing low, May 2012. It indicates sellers did not feel the need to see how the swing low would be retested. They aggressively embarked upon their selling campaign certain that lower prices were next.
The August swing high will be defended by those who sold at that level, which will make it resistance. There is a relatively smaller resistance level, marked on the chart, at 1360.4, a smaller swing high. How the market responds to the known resistance levels will give an indication of the character of the existing trend.

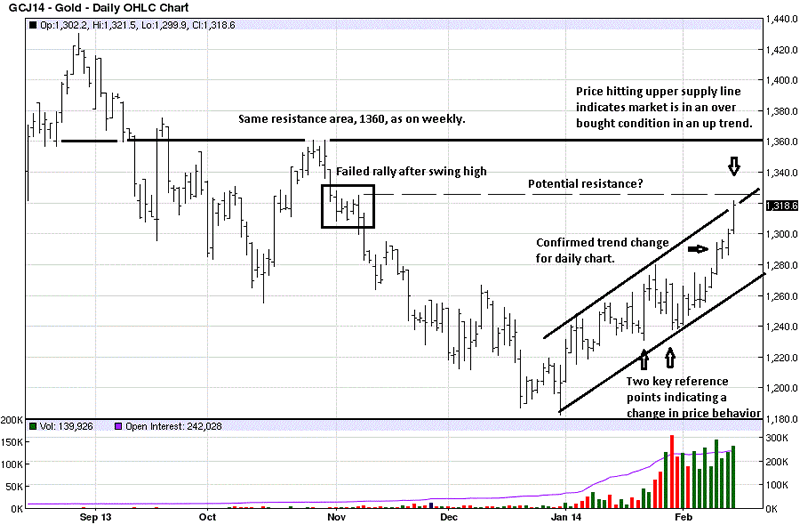
The daily trend is up, as defined by a two higher highs with a higher low in between. Once price rallied above 1280, it formed a higher high and confirmed a change in trend on the daily. Once that was confirmed, it was then easier to put the previous market activity into a context that supported the change in trend. Sometimes, recognizing changes can only be determined in hindsight.
The two wide range bars, with arrows under each, anchored the rally in gold. There was no way to know beforehand that gold would make higher daily lows for 10 days straight, and that left no [normal] reaction in which to buy. This is a decided change in market behavior, and if sustained, will continue building on the up trend just under way.
The primary resistance at 1360 is the same on the daily and weekly, giving greater weight to the daily chart. A lesser, potential resistance level is also shown by the dashed line from a failed retest rally, marked on the chart.
Money is not made buying potential resistance, which the 1280 area represented, and for that reason, we were not buyers and missed the last half of the rally. We did catch some of the earlier portion of it, however.
What we know for certain is that every market will have a normal correction, and it is at that point one can take a position with a more clearly defined risk. For now, we remain on the sidelines in the paper futures.
Pointing out the importance of not jumping to any conclusion that last week's strong rally has change the trend, a look back at the first arrow shows an earlier strong rally that did not change the trend. Everything needs to be confirmed, and the rally from the first arrow was never confirmed as a change in trend. Patience is a virtue in the markets.

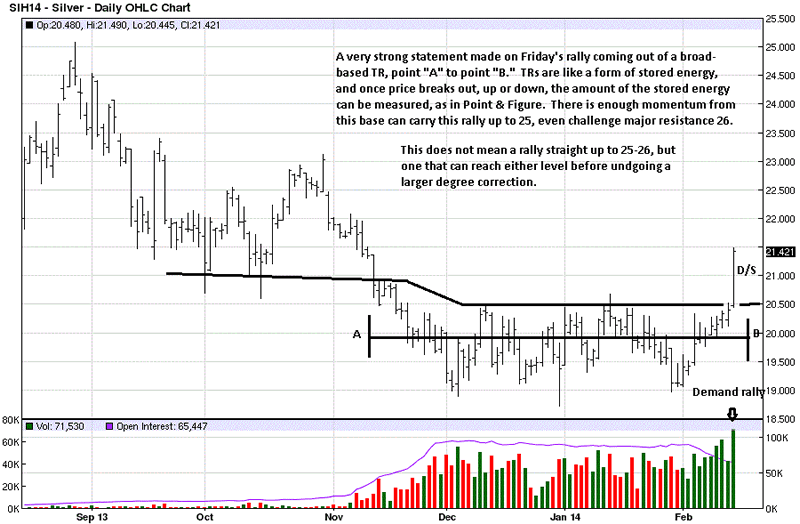
Friday's rally in silver was impressive, coming out of the protracted TR, [Trading Range]. When you measure from point "A" to point "B," that "stored energy" accumulated during the trading range reveals that the upside rally potential can carry silver to the 25 area, and even challenge the all important 26 resistance.
Silver also has bearish spacing, shown on the weekly chart, but it is not as great as the gold bearish spacing. There is a good possibility that silver can outperform gold, on the next important rally.
The "D/S" designated Demand overcoming Supply, and the sharp volume increase is very supportive of the rally. A great place to get long is on the retest of the breakout, and we will be watching how the next retest unfolds.