3 Indicators That Signaled The 2007 Top: They're Back
Disclosure: I am long DXD.
"Those who cannot remember the past are condemned to repeat it." - George Santayana
While the stock market, like other aspects of history, never repeats itself exactly, the similarities are sufficiently close so as to be instructive. This article examines three well followed indicators which signaled the top of the US stock market several months before its ultimate peak in October of 2007. It then compares them with their readings today, which unfortunately shows a strong similarity.
1. The Advance-Decline Line (A-D Line)
"Breadth" refers to the amount of participation in a general market trend. Technical theory has it that a trend is strong and likely to continue if there is broad participation. In a healthy bull market, a large percentage of stocks are rising. But as the market advances and time progresses, breadth will eventually diminish and fewer stocks will participate in the rally. Breadth is therefore a leading indicator; market breadth tends to top out before the averages do.
One commonly used market breadth indicator is the advance-decline line, which measures the net number of stocks advancing minus the number of stocks declining on a given day. During a bull market, the rise in stock prices will generally be confirmed by similar rises in the advance decline line and net new highs/new lows. The worry arrives when the A-D Line stops its upwards advance, as was the case in the summer of 2007 (source:stockcharts.com)
(click to enlarge)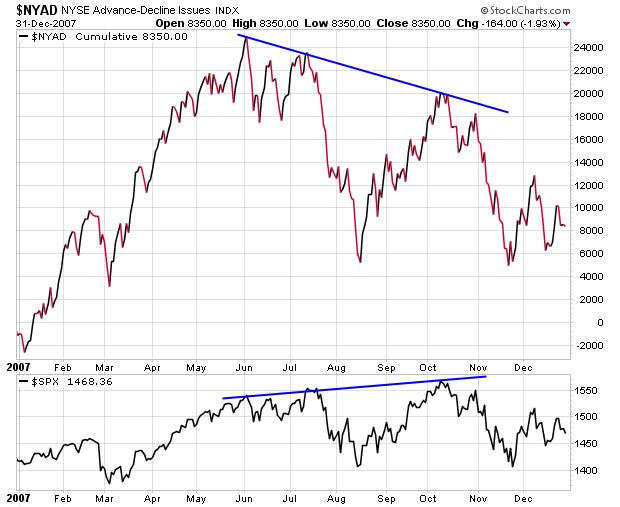
The warning signal came from the A-D Line failing to better its early June 2007 high, ultimately forming a succession of lower highs. This action diverged from the S&P, which continued to rise until early October.
Today's situation mirrors that of 2007, with the A-D Line topping out and diverging from the continuing rally in the S&P:
(click to enlarge)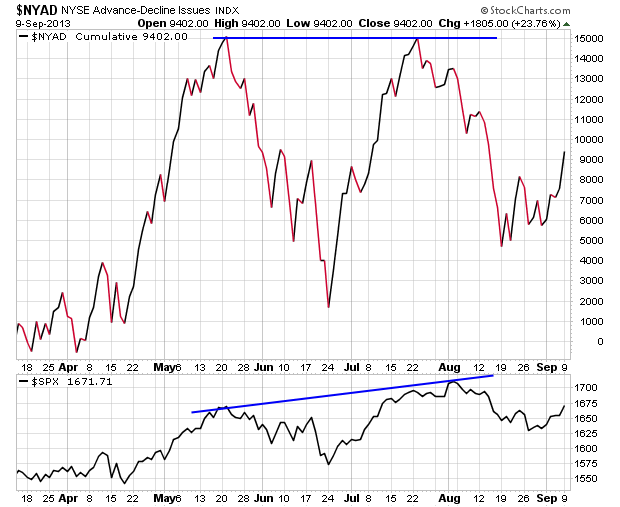
2. Copper
Copper has been credited as the "PhD in Economics" because of its ubiquitous and nearly essential role in the economy and consequently as a leading indicator of economic health.
Copper topped out in May of 2007, forming a divergence from the continuing stock market rally and warning of its pending decline.
(click to enlarge)
A similar picture is revealed today:
(click to enlarge)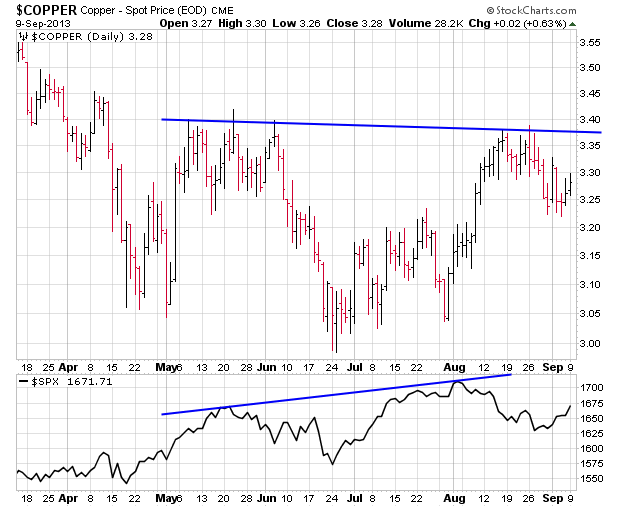
3. Money Supply is Rolling Over
Money drives the economy and fuels the stock market. When growth in the money supply slows, the stock market tends to react bearishly to this reduction in its fuel. It happened in early 2008, several months after the October stock market peak but many months ahead of the September 2008 financial meltdown. (Source: economicpolicyjournal.com)
(click to enlarge)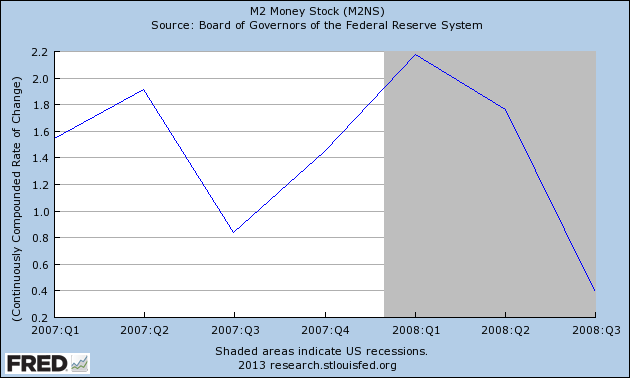
Growth in the money supply has started to slow again:
(click to enlarge)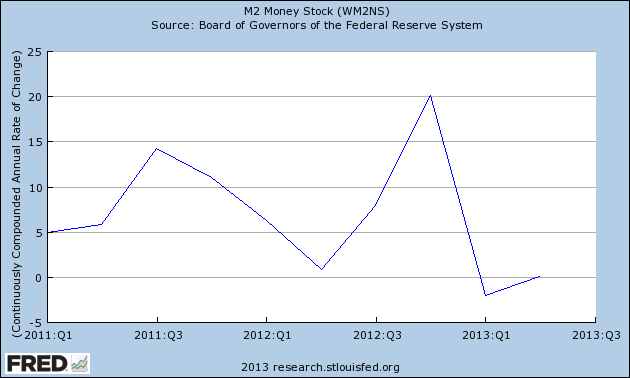
Conclusion
It is very difficult to find a leading indicator for the stock market. One is reason is the stock market itself is a leading indicator of the economy in general. Certainly no single indicator is infallible. But these three indicators have largely stood the test of time and as a result they continue to be indicators that are followed by sophisticated market participants.
We are now in the 54th month of the bull market that began in March of 2009. Reduced exposure to equities at this time is a sensible strategy. Protection against any potential decline can be had through various inverse ETFs and ETNs. ProShares offers their UltraShort Dow 30 (DXD) which seeks to duplicate two times the inverse of the daily performance of the Dow Jones Industrial Average. The leverage in the product requires less capital to hedge a position. I generally prefer this strategy to shorting individual stocks as borrowing the stock can be both difficult and occasionally expensive, and potentially subject to buy in requirements. For those wanting other ETF hedges, Seeking Alpha has numerous excellent articles on ETF strategies found here. I personally have chosen to buy in-the-money put options on the SPDR S&P 500 (SPY) as a way of obtaining more leverage on a smaller investment amount, while paying a minimum of premium.
Each of the indicators in this article correctly anticipated the great bear market of 2008/2009. They are speaking in the same voice again today and it is a voice that should be given proper consideration.
Additional disclosure: I am short the S&P 500 through in-the-money put options on SPY.