Gold Timing: Intermediate Lows at Hand
For now, it sure looks like the decline we call D is over. And the more time passes, the more likely the closing low at $1211.60 on June 27 was THE low.
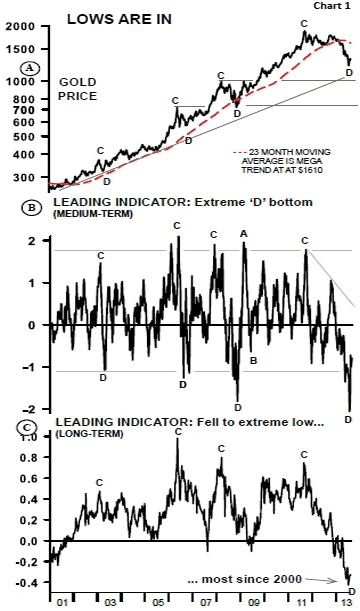
Just looking at the indicators, you can see why. The extreme D low on Chart 1B shows a bottom forming in this extreme area. This has become a springboard for an intermediate rise, we call A.
Plus, with the long-term indicator also at an extreme low, it reinforces this springlike formation (see Chart 1C).
Again, today's low level is giving us a good opportunity to buy at good prices... and we recommend taking advantage of it.
For now, watch these stepping stone levels on the way up...
If gold can rise and stay above $1400, it'll mean that it could jump up to the $1500-$1565 level.
After that we have the $1700, $1800 and $1900 levels to surpass before getting to record highs.
Overall, however, the current rise will tell us a lot about the strength (or weakness) of the gold market. If it doesn't hit a new record high, it'll be a first for the entire bull market and a clear bearish sign.
If a record high is eventually reached, gold will be signaling that the bull market is ongoing and it's strong, in spite of the almost two year correction that took 36% away from the bull market.
We're watching this closely!