|
SPDR S&P 500 (NYSE:SPY)
|
|
 |
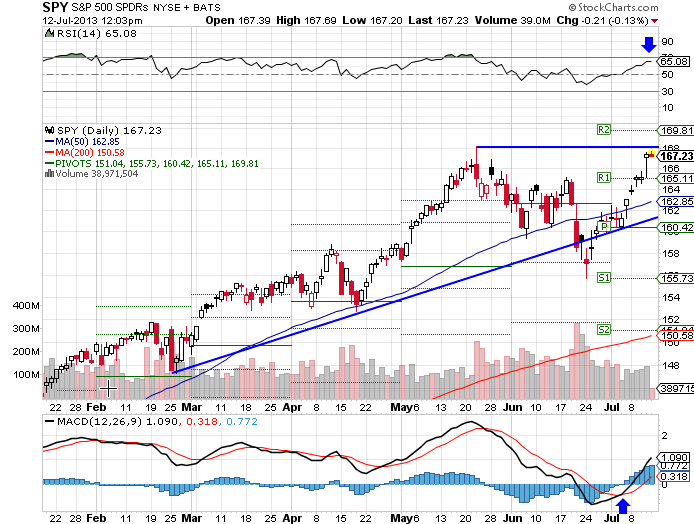
The SPDR S&P 500 (NYSE:SPY) ETF rose 2.31%, as of early trading on Friday morning. After rebounding from lower trend line support at 161.00 and breaking through R1 pivot point resistance at 165.11, the index moved up to test a prior high at 168.00 this week. Traders should watch for a break of this key level on the upside or a move back down to the R1 pivot point or 50-day moving average of 162.85 on the downside. Looking at technical indicators, the RSI appears overbought at 65.08, while the MACD remains in a bullish crossover.
|
SPY--7-12-13
所有跟帖:
•
Thanks!
-lightofflower-
♀
![]() (0 bytes)
()
07/14/2013 postreply
14:19:50
(0 bytes)
()
07/14/2013 postreply
14:19:50
•
谢谢 我知道你是谁:)
-aimei080808-
♀
![]()
![]() (0 bytes)
()
07/14/2013 postreply
14:29:35
(0 bytes)
()
07/14/2013 postreply
14:29:35