Market Briefs & Sentiment Outlook (MBSO)
Reported by Tony Carrion
http://www.market-harmonics.com
Our Stock Market Outlook - January 2013
With 2012 behind us, and the can being kicked over to the other side of the fiscal cliff, where do stocks currently sit with respect to our December forecast? We had discussed seeing a bit of "Scrooge and Santa" and indeed both paid their visits during the month. As we wrote on December 2nd, "while we are in fact expecting at least some amount of retracement of the advance since November 16th, we believe, as I said last month, that a push to new highs cannot be discounted." That opinion was based on our interpretation of the near and intermediate term Elliott Wave patterns we believe are playing out in the market, as well as the sentiment trends, which we continue to see as mixed to mildly bullish. Our view on both is unchanged.
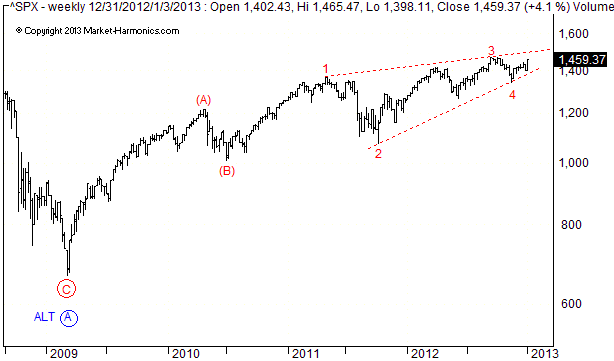
Because of both the "look" and persistently corrective-style advance and decline patterns, we embraced back in the summer a wave model that considered the advancing pattern in the S&P 500 (and Dow) as a Wave (C) diagonal triangle. The mixed sentiment climate is wholly consistent with this model, reflecting the indecision in the market. At the same time, the stronger bias has been to the upside. Wave (C) should be in the final fifth wave of the diagonal if our analysis is correct, and would produce a high above the 1474 peak of last September. Per last month's comments, we are expecting this fifth wave to evolve as a zigzag or double zigzag pattern, "exceeding the 1474 high of September towards the 1500 level." The advance and decline since November 16th are probably best labeled as Waves ( a ) and ( b ), with the rally that broke out on January 2nd as a developing Wave ( c ). With the index having traded as high as 1465, a retest of the September peak is not an impossibility, although perhaps more of a rocky road getting there. At least this is where we place the greater probability for now.
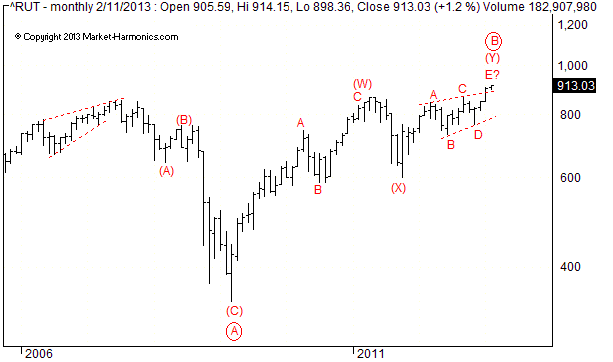
Shifting to a look at small caps basis the Russell 2000 index, the Elliott Wave model is somewhat different than that for the S&P, though with essentially the same import as regards what we expect to happen next. In terms of the wave pattern itself, we are modeling the final (and obviously sideways) stages of the advance since October 2011 as a triangle within a much larger double three pattern in effect since 2009. The triangle may be completing its final leg, or alternatively its third (i.e., Wave C) leg, although the best Fibonacci ratios occur with the red labels. Either labeling is consistent with how small caps relative to large caps have had a tougher go of it over the past year, although more recently they have been showing greater relative strength to the overall market. Even under the red labels, an attempt towards the 886-887 level, and perhaps beyond towards 900 cannot be discounted. That said, and while we expect the final highs in the Russell still lie ahead, we also take note of growing complacency among small cap investors.
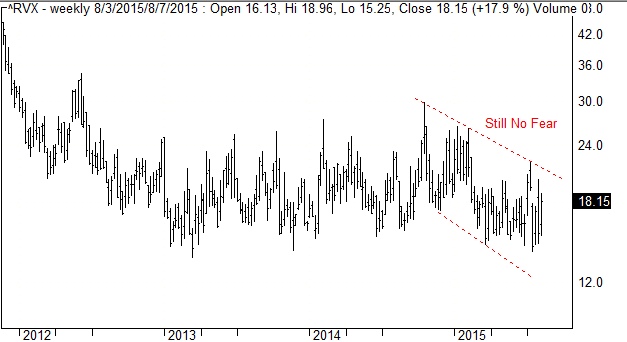
The RVX index is to the Russell 2000 what the VIX is to the S&P 500. In other words, it is a gauge of investor fear vs. complacency relative to small cap stocks. Since hitting a "fear spike" in October 2011, the RVX has been in an essential downtrend, indicating decreasing levels of fear in holding these more volatile stocks. While clearly not at its most extreme level of complacency recorded back in February 2007, it is arguably reaching a potential "danger zone" as it trends lower. Consequently, the potential ending of its triangle, coinciding with increasingly complacent small cap sentiment, both raise the specter of an inflection point and hard reversal being reached.
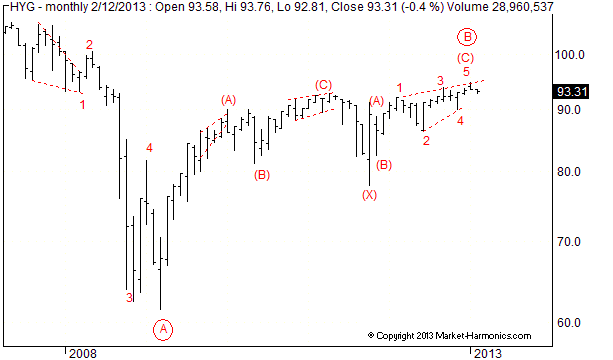
Looking at one of our key barometers of sentiment, particularly with respect to "risk on-risk off," we note that the iShares High Yield Corporate Bond ETF (HYG) displays a similar ending triangle pattern as we noted for both the S&P 500 and Russell 2000. As expressed previously, we believe that looking a one of the riskiest of asset classes (and one highly correlated to stocks) provides us with good insight as to whether investors are likely to add or shed risk. Like the SPX and Russell, the triangle in HYG still appears incomplete with room for further upside. However, we also argue that this pattern, which has been in effect for nearly 14 months, is fairly mature and in danger of sharp reversal once the final leg of the triangle is complete.
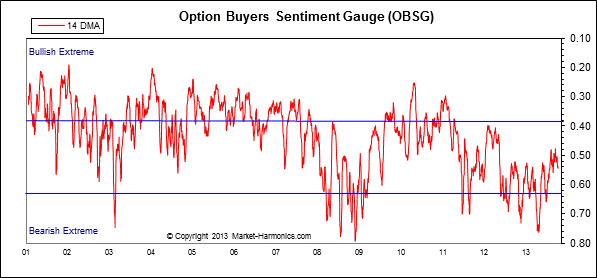
Another of our key barometers, the Options Buyers Sentiment Gauge has continued its rise since November 13th, when it reached its most bearish reading since January 2009. While it could always reverse towards bearish territory, we think there still remains some room for a further push into bullish territory over the near term. This would obviously be supportive of further upside for stocks.
To sum up, while we regard the near-term outlook as more bullish (allowing for the usual backing and filling) with respect to the bigger picture, we are also regarding any push to new highs as completion patterns, with the implication that we still remain in a multi-year secular bear market, whose lows with respect to price and valuations have not yet been seen.