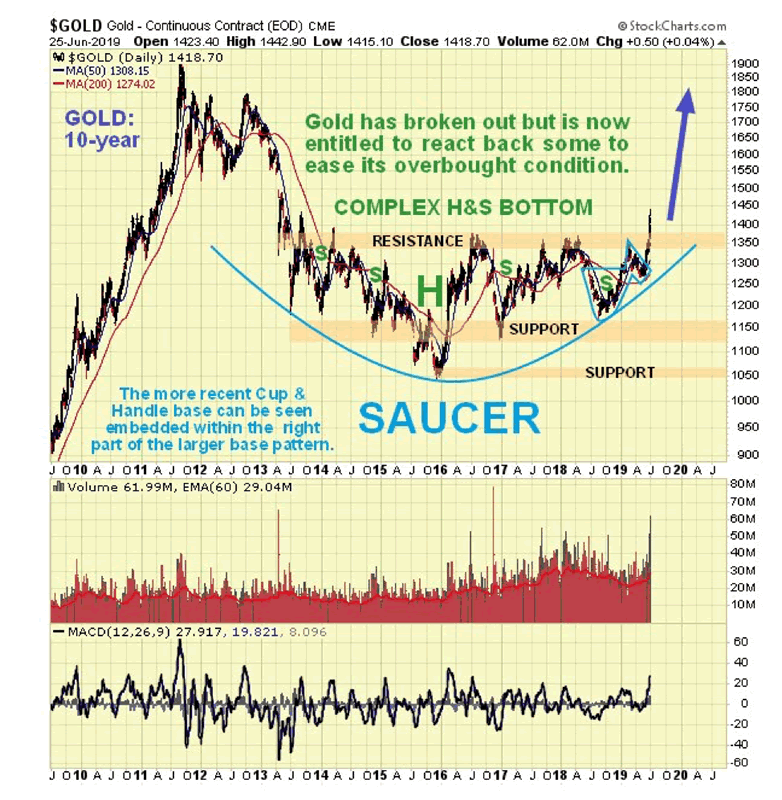
Let us wheel out our 10-year chart for gold to remind ourselves of the enormous significance of this gold breakout. As we see, gold is breaking out of a giant six-year-long head-and-shoulders bottom/saucer base pattern, which actually may be considered to be a lengthy reaction within a much larger bull market going to the early 2000s. This giant base pattern is capable of supporting a massive bull market that looks set to go way beyond the earlier highs in 2011.