Recently investors witnessed an event that hasn't been seen in over a decade. Many portend that when this phenomenon occurs, a recession may be looming. This event is an inverted Treasury yield curve. An inverted yield curve is a rare occurrence when short-term interest rates rise above long-term interest rates.
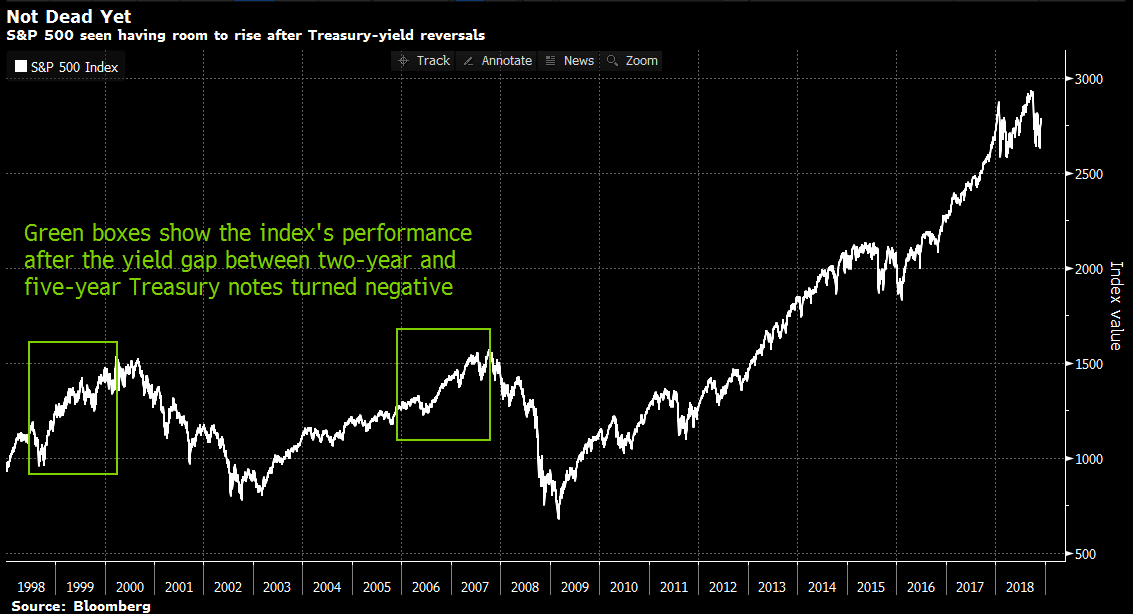
The chart above depicts how the S&P 500 Index performed after two past Treasury-yield reversals. The first noted reversal was in 1998, the second in 2005. Per Bloomberg data, in both cases the S&P 500 continued to move higher for nearly two years before hitting its peak, capturing gains of 38% after the 1998 yield curve inversion and 24% post 2005's yield curve inversion.
Of course, past performance is not indicative of future results. But this chart may predict that the S&P 500 has room to grow.
 选择“Disable on www.wenxuecity.com”
 选择“don't run on pages on this domain”

