https://www.thetechnicaltraders.com/calm-before-the-storm/
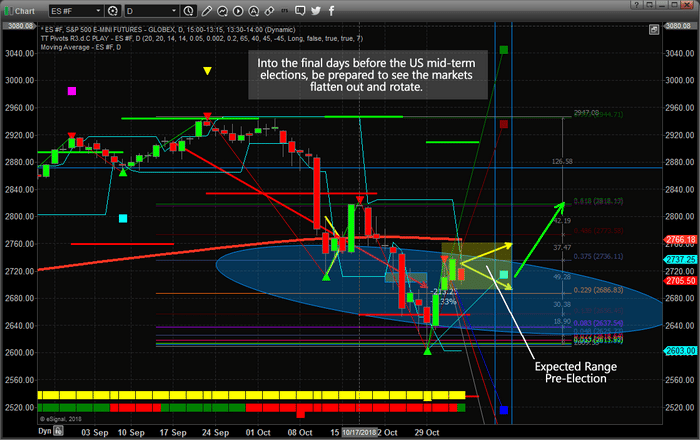
This Daily ES chart illustrates where we believe the price will stay before the US elections (The YELLOW arrows/box drawn on the chart). This range is roughly from 2690 to 2750 on the ES. We’ve also drawn two thin blue vertical lines that represent Nov 8 and Nov 12 – the dates which we expect the markets to establish a true price bottom and begin an upward price rally from. Additionally, we are displaying what we call “True Fibonacci Levels” on this chart in reference to key price target levels. We believe the initial upside price target will focus on the 2816 price level in the ES, then potentially push higher to the 2942 range. These True Fibonacci Levels are derived from our modeling systems calculations of Fibonacci Number Sequence relationships.
https://www.thetechnicaltraders.com/gold-sets-up-for-a-november-2018-rally-to-near-1300/
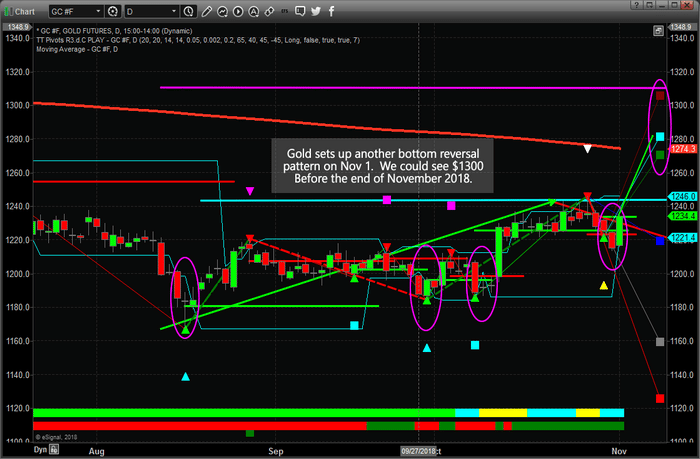
Today’s upside price move in gold, already up over $18 (+1.5%), sets up a real potential for a move to near $1300 before the end of November.
 选择“Disable on www.wenxuecity.com”
 选择“don't run on pages on this domain”

