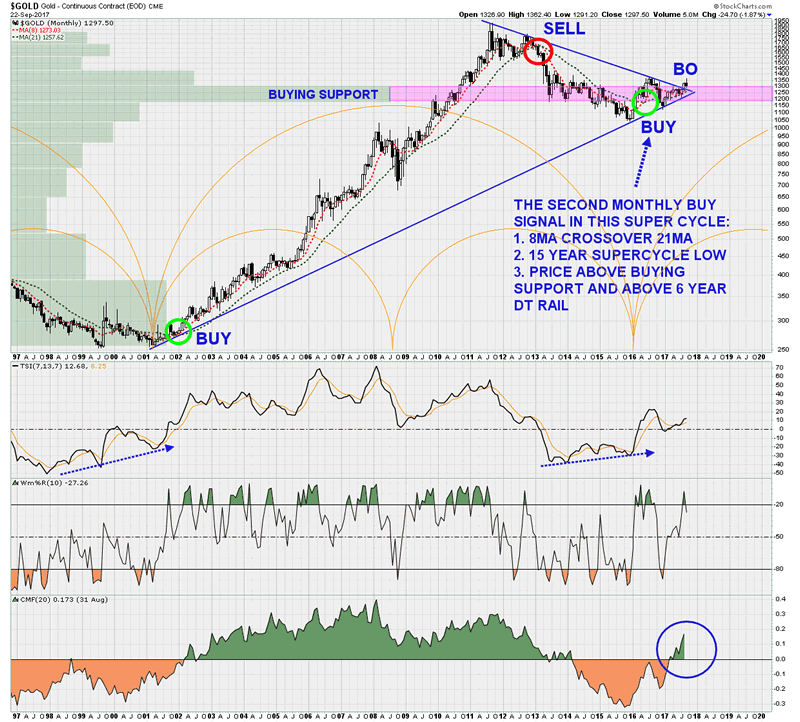
This is a monthly chart, using the 8 and 21 simple moving averages to generate the BUY and SELL signals. 8 and 21 are Fibonacci numbers.
There are only two BUY signals on this chart: 2001 and 2016, 15 years apart. The last SELL signal was in late 2012 for $GOLD. Do not expect the next SELL signal until at least 2026/27, 10 years from now, two thirds of the way into this new 15 year super cycle.