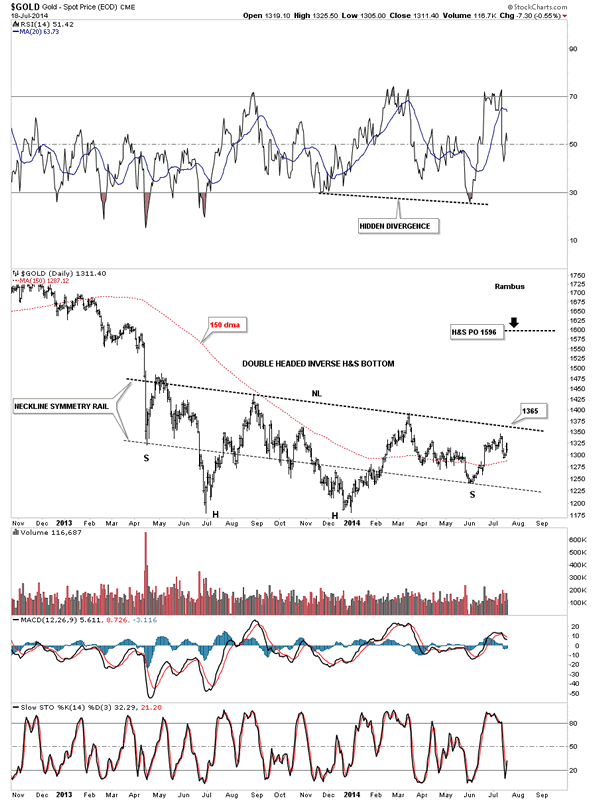
In the daily chart for gold, we can see a a double headed inverse H&S bottom that has been forming over the last year or so. Right now it looks like the neckline resistance will come in around the 1365 area which gold will have to overcome to enter into the next move higher. One step at a time. The chart is also showing a big divergence with the RSI and the bottom of the right shoulder. As we can see, the RSI at the top of the chart, bottomed at the December low along with gold. They both rallied up to the March highs where they both started to decline. The RSI declined and took out the December low while gold's decline was very modest and made a much higher low than the December low, which so far is the bottom of the right shoulder. This is a big divergence to say the least. Time will tell how this plays out but gold will have a head start vs the RSI if it decides it wants to put on a decent rally phase.
一年前金牛在1600处被狠狠地击溃,但是重回1600(H&S PO 1596)应该不是梦吧?
Read more: http://rambus1.com/?p=25513
Read more: http://rambus1.com/?p=25513
 选择“Disable on www.wenxuecity.com”
 选择“don't run on pages on this domain”

