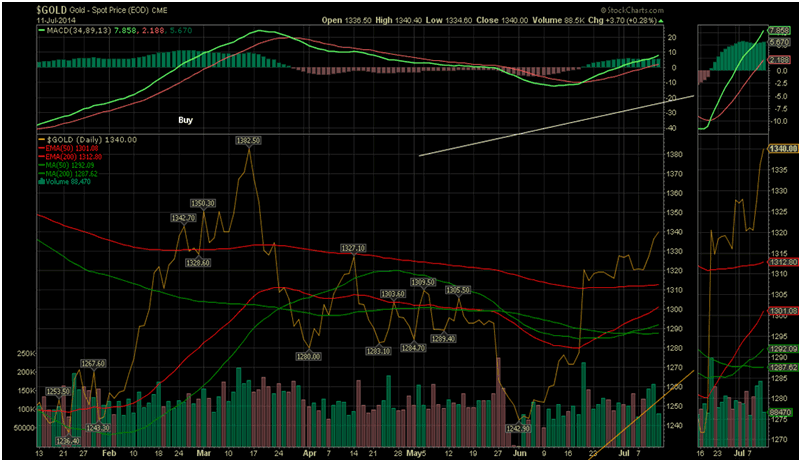
The above Gold six month Daily chart shows the Red Ma`s are the Ema, Exponential Moving Average, which will cross with a bit more upside effort. The Green are the Simple Arithmetic Moving Averages, WHICH HAVE CROSSED UP this last week.
说的在理,看看这个短期的图。。。
本文内容已被 [ iTrade668 ] 在 2014-07-14 21:13:14 编辑过。如有问题,请报告版主或论坛管理删除.
 选择“Disable on www.wenxuecity.com”
 选择“don't run on pages on this domain”

