Chart #1 – Death Cross of the XAU
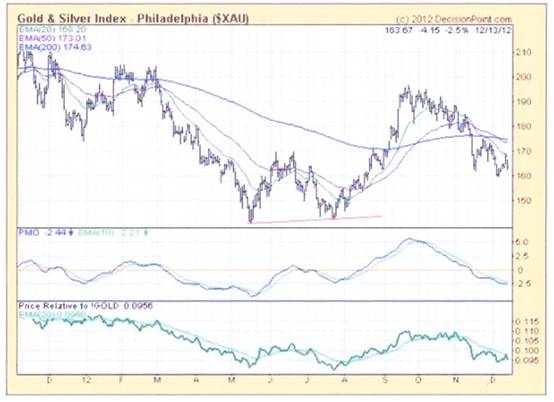
Note how the 50 day MA has fallen below the 200 day MA. This is referred to by some in the charting world as a “Death Cross”.
Chart #2 – Ratio of Gold Share index divided by Gold Price
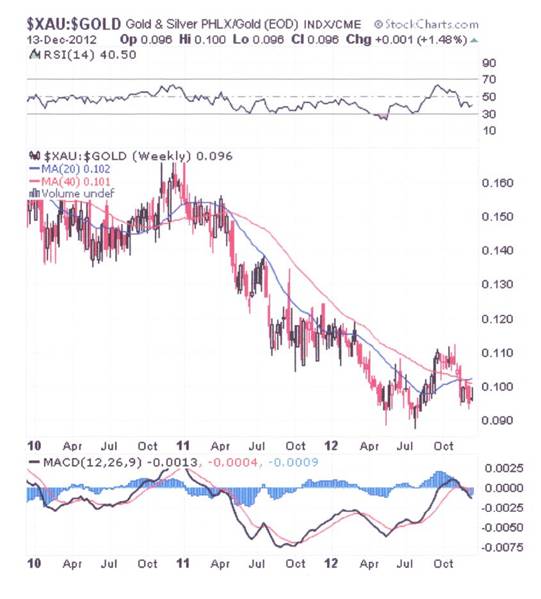
This weekly chart is showing a break-UP of the 20 week MA above the 40 week MA but, more relevant, the ratio gave a sell signal in April 2011 when the 20 week MA crossed below the 40 week MA.
 选择“Disable on www.wenxuecity.com”
 选择“don't run on pages on this domain”

