Many individuals find it difficult to believe any projections for gold, either higher or lower, because gold is hated, loved, often ignored, and seldom understood or recognized as the ultimate currency. However, most people know that the US government national debt is huge and will grow much larger during the next decade. Examine the following graph:
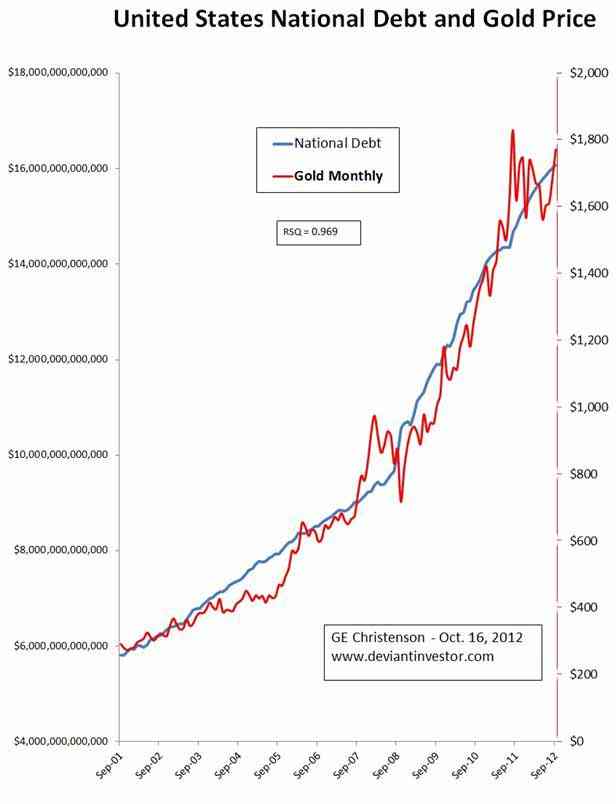
National debt is plotted on the left axis – yes, it was larger than $16 Trillion as of September 30, 2012. Gold is plotted on the right axis. The data covers an 11 year span from September 2001 through September 2012. This period includes the time after the stock market crash of 2000, the game-changing events of 9-11, the real estate crash, and the new bull market in commodities. Each month represents one data point. Note the similarity between the two trends. The statistical measure R-Squared for this 11 year period of monthly data is 0.969 – very high. I believe it is very likely that national debt and the price of gold will continue their 11 year exponential growth trend.
Since gold correlates closely with national debt, we now have a clear, objective, and believable proxy (national debt) to model the future price of gold. Extend national debt and gold prices forward for the next five years based on the exponential increase from the last five years, and the result is the following table. Bracket gold prices, high and low, based on past annual volatility at about 15%.
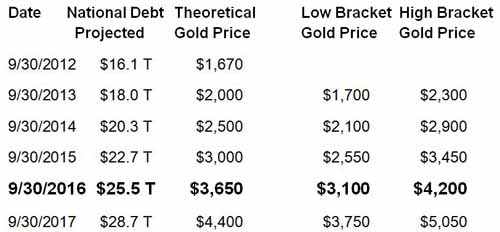
As you can see, this projection for gold prices indicates that gold could reach $4,000 as early as September 2016, with a theoretical projected price of $4,000 in late 2016 or early 2017.
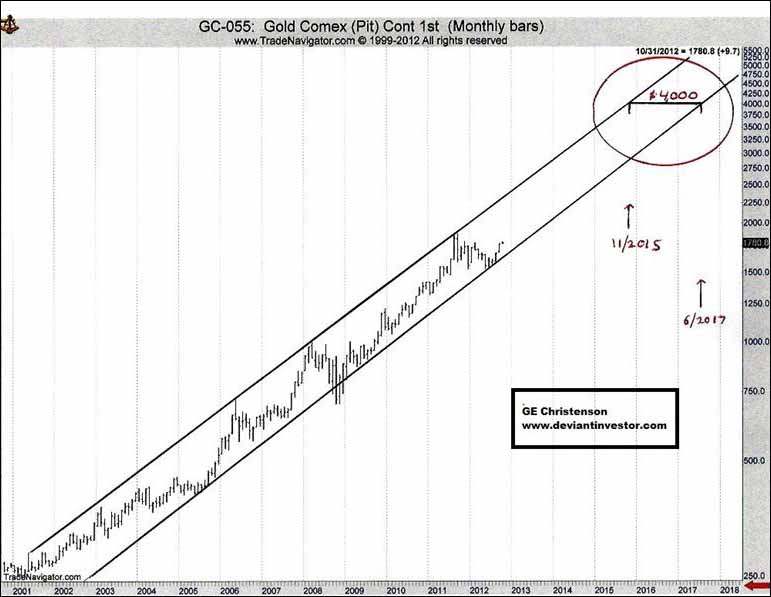
The next graph shows the price of gold, on a logarithmic scale, with high and low trend lines. The horizontal line at $4,000 shows the earliest and latest dates at which the trend lines project gold will reach $4,000. Those dates are November 2015 through June 2017, which are consistent with the above projection based on the tight correlation to the national debt.
We may be skeptical of price projections for gold, but projections for national debt are quite believable. Since the correlation is very close, future gold prices can be projected, assuming continuing deficit spending, QE, and other macroeconomic influences. Another crash or an unexpected bout of congressional fiscal responsibility could accelerate or delay the date gold trades at $4,000, but the projection is reasonable and sensible. Gold increased from $270 (July 2001) to over $1,200 (December 2009). An increase of that size seemed utterly improbable in 2001, yet it happened. An increase from about $1,700 (October 2012) to $4,000 (perhaps early 2017) seems much easier to believe, especially after Bernanke’s recent announcement of QE4-Ever.