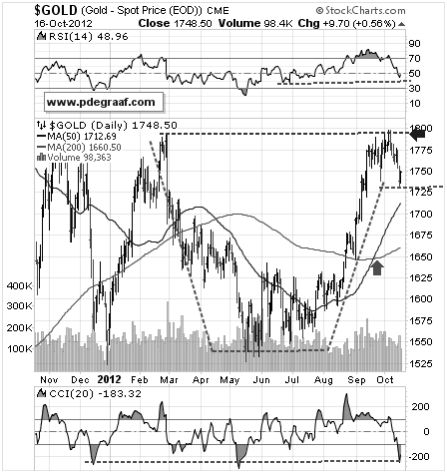
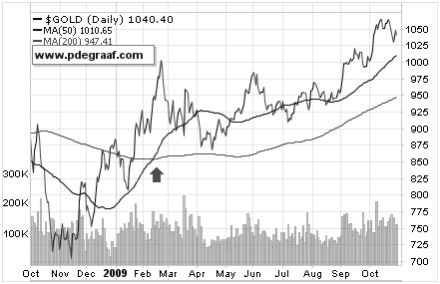
Featured is the daily gold chart. Price is carving out a bullish 'cup with handle' formation. This type of chart formation most often resolves to the upside. The two supporting indicators are back at support levels. The 50DMA is in positive alignment to the 200DMA, while both are in rising mode for the first time since we saw a similar pattern (called a 'golden cross'), in early 2009, see next chart. A breakout at the arrow will turn the trend bullish again.
 选择“Disable on www.wenxuecity.com”
 选择“don't run on pages on this domain”

