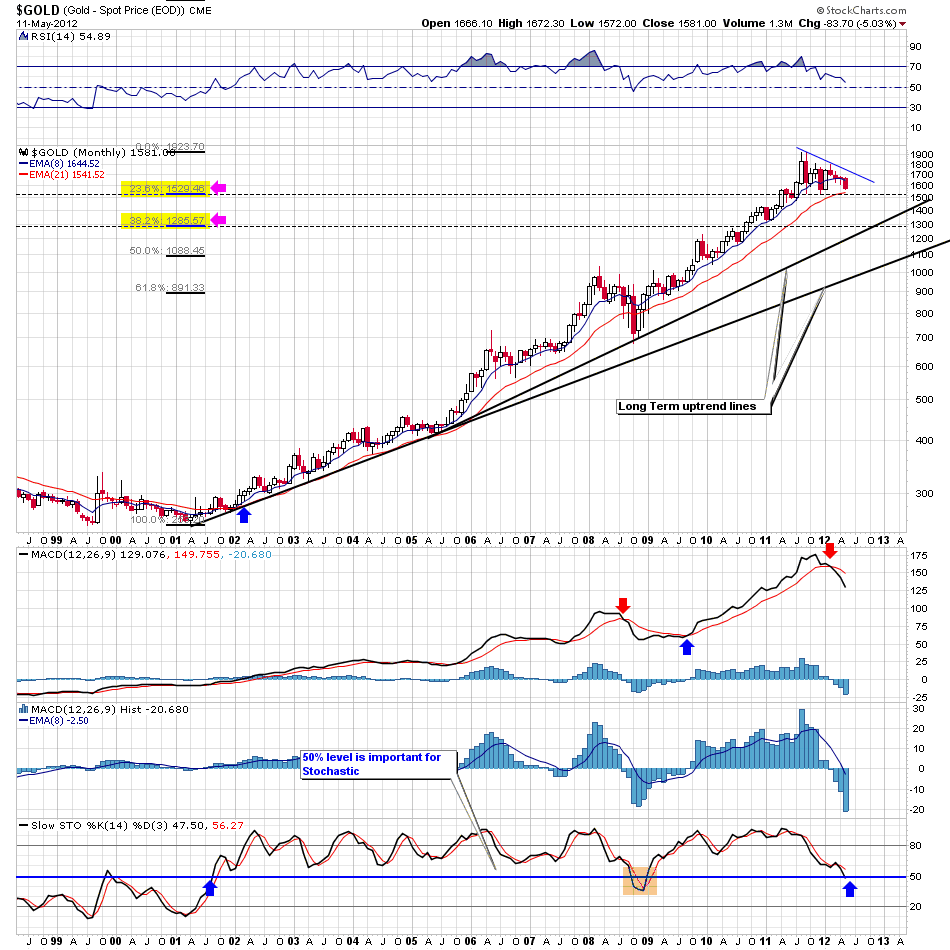
第一个是十三年的图
The first chart shows a monthly 13 year chart of gold. A bearish MACD cross occurred earlier this year, that was a negative sign. The first major support is the 23.6% Fibonacci retracement at 1529 (see the yellow shaded area). However below that the next major support areas are the long term uptrend lines (in black). The problem with going below a $1000 as you said, is that it would lose the long term uptrend line from 2001, which marked the beginning of the gold bull market.
The second chart shows a revision to the mean chart of gold i.e. the indicator at the bottom shows the percentage that gold is away from its 200 day MA. Back in August of last year I warned about a top in gold since it got over 25% away from its 200 day MA; as you can see all the past major peaks corresponded with gold getting 20% - 25% away from its 200 day MA. Currently gold is -7.9% below its 200 ay MA, therefore it's below the mean of the past corrections (which averaged in the -4 to -5% range, but well below the -18% which occurred in 2008. If Gold were to repeat the 2008 scenario and fall to 18% below its 200 day MA, this would put a price of about $1400 or high $1300's for gold, which is well above the $1000 price range you are talking about!
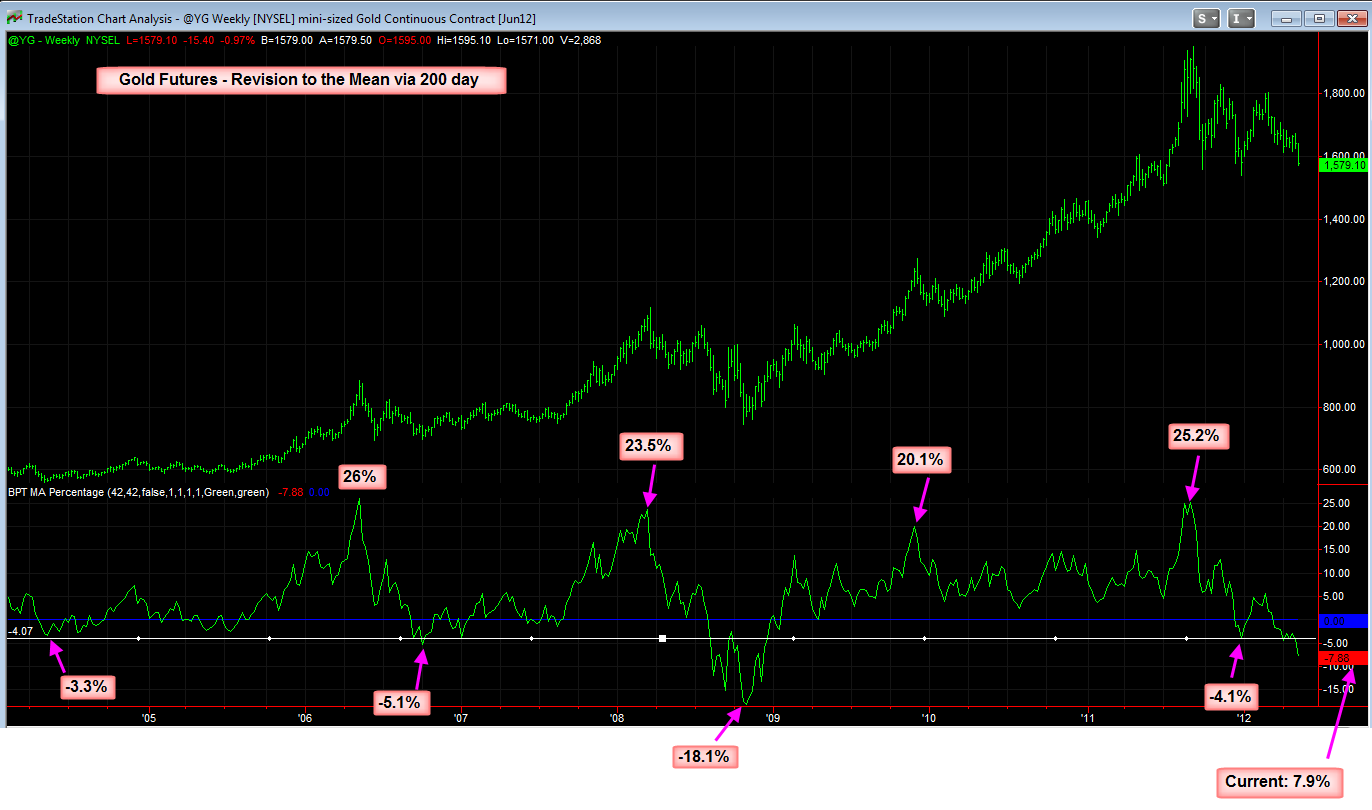
Chart # 3 shows a daily view of gold with my best guess as to the Elliot Wave pattern. I see this correction as a complex ABC,WX,ABC,Y correction. I think once it's over later this year, probably in the early Fall time frame, gold will be ready to rally again.
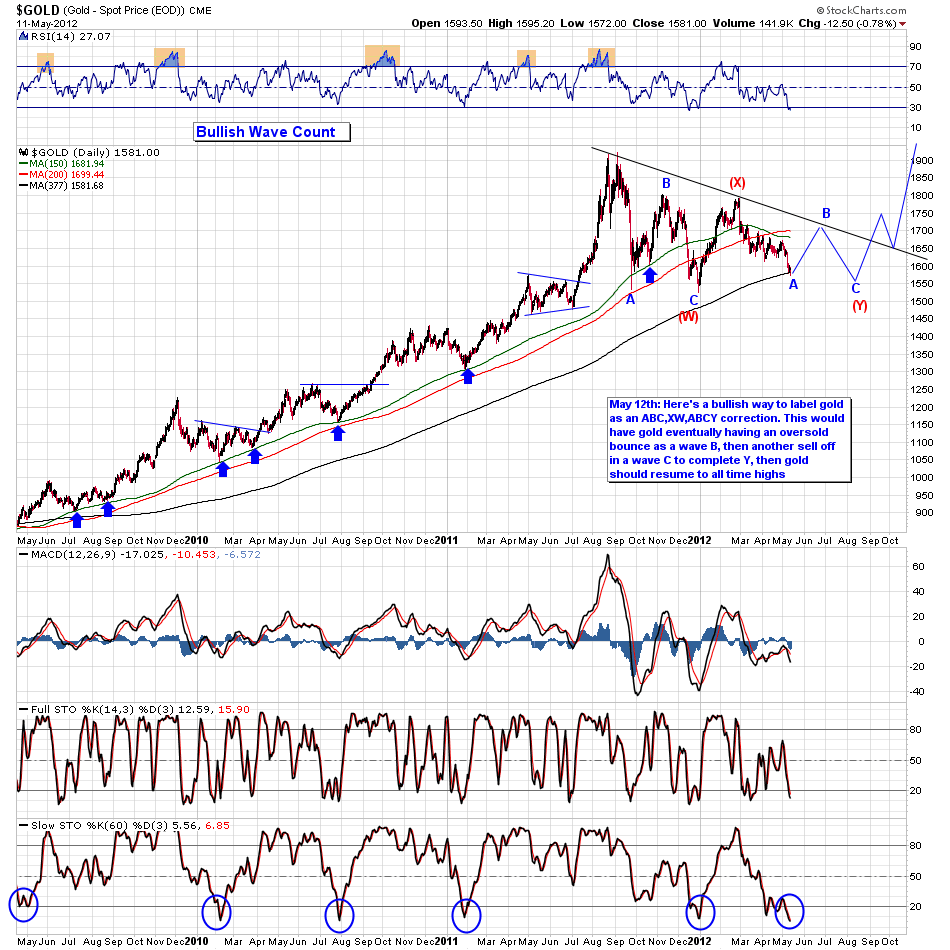
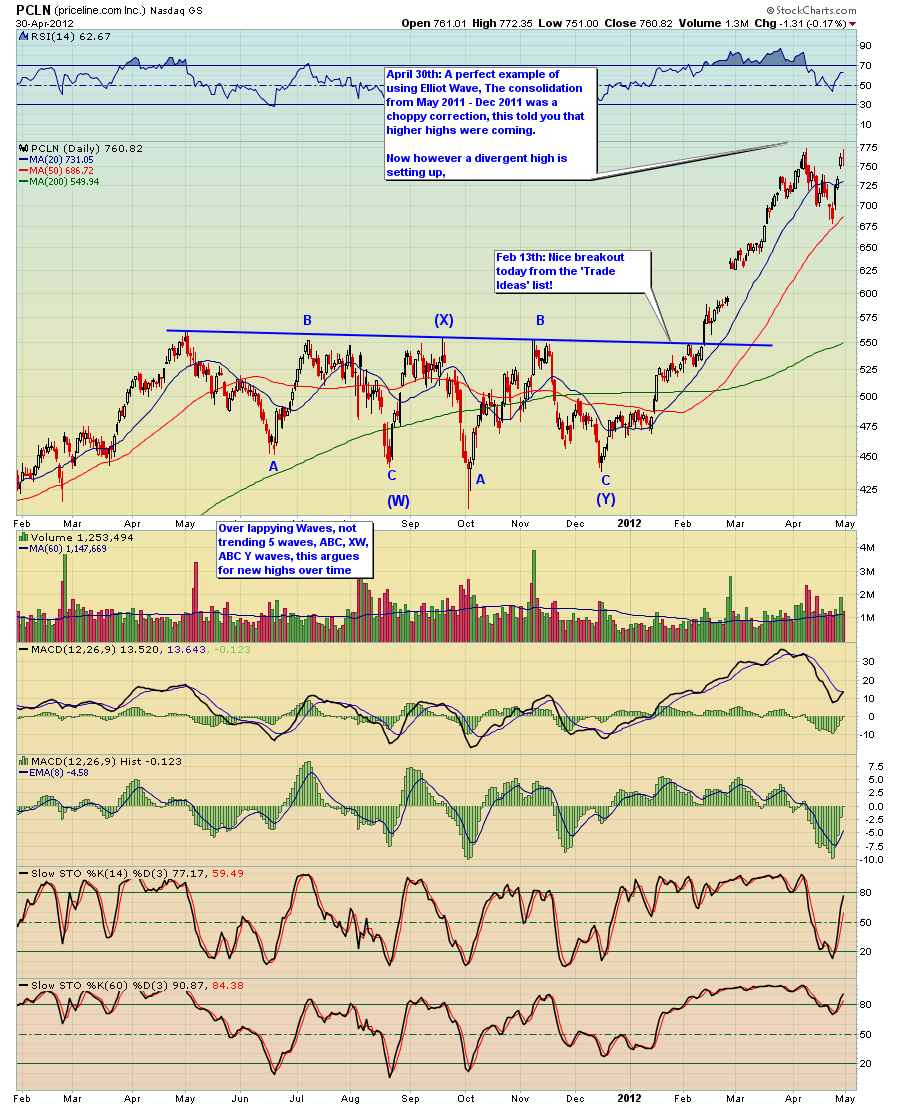
chart number 4 shows you an example of his wave structure in a stock of PCLN, again this simply shows you an example.