if the VIX is 15, this represents an expected annualized change of 15% over the next 30 days or [1.15 ^ (1/12)]; thus one can infer that the index option markets expect the S&P 500 to move up or down  over the next 30-day
VIX
VIX is the ticker symbol for the Chicago Board Options Exchange Market Volatility Index, a popular measure of the implied volatility of S&P 500 index options. Often referred to as the fear index or the fear gauge, it represents one measure of the market's expectation of stock market volatility over the next 30 day period. The VIX Index was introduced by Prof. Robert Whaley in 1993 while he was at Duke University.
Contents[hide] |
[edit] Specifications
The VIX is calculated and disseminated in real-time by the Chicago Board Options Exchange. It is a weighted blend of prices for a range of options on the S&P 500 index. On March 26, 2004, the first-ever trading in futures on the VIX Index began on CBOE Futures Exchange (CFE). As of February 24, 2006, it became possible to trade VIX options contracts. A few Exchange Traded Funds seek to track its performance. The formula uses a kernel-smoothed estimator that takes as inputs the current market prices for all out-of-the-money calls and puts for the front month and second month expirations.[1] The goal is to estimate the implied volatility of the S&P 500 index over the next 30 days.
The VIX is the square root of the par variance swap rate for a 30 day term initiated today. Note that the VIX is the volatility of a variance swap and not that of a volatility swap (volatility being the square root of variance). A variance swap can be perfectly statically replicated through vanilla puts and calls whereas a volatility swap requires dynamic hedging. The VIX is the square-root of the risk neutral expectation of the S&P 500 variance over the next 30 calendar days. The VIX is quoted as an annualized variance.
The VIX has replaced the older VXO as the preferred volatility index used by the media. VXO was a measure of implied volatility calculated using 30-day S&P 100 index at-the-money options.
[edit] Interpretation

The VIX is quoted in percentage points and translates, roughly, to the expected movement in the S&P 500 index over the next 30-day period, which is then annualized. For example, if the VIX is 15, this represents an expected annualized change of 15% over the next 30 days or [1.15 ^ (1/12)]; thus one can infer that the index option markets expect the S&P 500 to move up or down  over the next 30-day period.[2] That is, index options are priced with the assumption of a 68% likelihood (one standard deviation) that the magnitude of the S&P 500's 30-day return will be less than 4.33% (up or down).
The price of call options and put options can be used to calculate implied volatility, because volatility is one of the factors used to calculate the value of these options. Higher (or lower) volatility of the underlying security makes an option more (or less) valuable, because there is a greater (or smaller) probability that the option will expire in the money (i.e., with a market value above zero). Thus, a higher option price implies greater volatility, other things being equal.
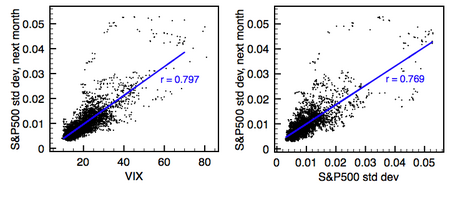
Despite its sophisticated composition, however, the predictive power of VIX is similar to that of simpler measures, such as past volatility (see graphs on the right).
Even though the VIX is quoted as a percentage rather than a dollar amount there are a number of VIX-based derivative instruments in existence, including:
- VIX futures contracts, which began trading in 2004
- exchange-listed VIX options, which began trading in February 2006.
- VIX futures based exchange-traded notes and exchange-traded funds, such as:
- S&P 500 VIX Short-Term Futures ETN (NYSE: VXX) and S&P 500 VIX Mid-Term Futures ETN (NYSE: VXZ) launched by Barclays iPath in February 2009.
- S&P 500 VIX ETF (LSE: VIXS) launched by Source UK Services in June 2010.
- VIX Short-Term Futures ETF (NYSE: VIXY) and VIX Mid-Term Futures ETF (NYSE: VIXM) launched by ProShares in January 2011.
Similar indices for bonds include the MOVE, LBPX indices.
Although the VIX is often called the "fear index", a high VIX is not necessarily bearish for stocks. Instead, the VIX is a measure of market perceived volatility in either direction, including to the upside. In practical terms, when investors anticipate large upside volatility, they are unwilling to sell upside call stock options unless they receive a large premium. Option buyers will be willing to pay such high premiums only if similarly anticipating a large upside move. The resulting aggregate of increases in upside stock option call prices raises the VIX just as does the aggregate growth in downside stock put option premiums that occurs when option buyers and sellers anticipate a likely sharp move to the downside. When the market is believed as likely to soar as to plummet, writing any option that will cost the writer in the event of a sudden large move in either direction may look equally risky. Hence high VIX readings mean investors see significant risk that the market will move sharply, whether downward or upward. The highest VIX readings occur when investors anticipate that huge moves in either direction are likely. Only when investors perceive neither significant downside risk nor significant upside potential will the VIX be low.
The Black-Scholes formula uses a model of stock price dynamics to estimate how an option’s value depends on the volatility of the underlying assets.
