Living With Volatility Skew
Stan Freifeld - Mar 8, 2008
© Copyright 2008 by MrSwing.com
Last week we learned about three different types of volatility; historical, implied and future predicted. Since volatility is such an important topic, this week we're going to talk more about volatility and in particular the concept of volatility skew (also called the volatility smile) and how we can use it in our options trading to make profitable trades. Before we can use it, we have to recognize it, and before we can recognize it, we have to define it. So, for our purposes volatility skew will refer to situations where there is a difference in implied volatility between the various options of a given underlying asset. It applies to every asset class, but in my articles we have been referring mostly to stock options.
If you remember back to our discussion of the Black Scholes pricing model, we said that one of the input variables is future predicted volatility. The assumption in the model is that this volatility variable will be constant over all the strike prices of the options for a given expiration. For example, for XYZ stock, all of the options that expire in October (or any month) will have the same volatility. Well a casual look at the implied volatilities for the various strike prices will clearly show that this generally is not the case. This is the concept of skew.
There are three types of skew that we will be concerned with: put/call skew, vertical skew and horizontal skew.
PUT/CALL SKEW
Put/Call skew refers to the Put and Call options at a particular strike price, trading at different implied volatilities. When exchange traded options first started trading in 1973 this type of skew was quite common and a source of significant income for the market makers and other traders who could recognize the skew and react quickly enough to take advantage of it. There were actually traders who made a living just looking for this type of situation. Today, with advanced computer systems constantly scanning market prices and volatilities, the put/call skew is virtually non-existent for the public retail customer to take advantage of.
To get an understanding of how we could profit from this kind of skew, let's look at an exaggerated example. XYZ stock is trading at $81.50 and the July 80 options with 135 days to expiration are trading as follows (IV is implied volatility):

By looking at the pricing we see that the Call is trading at a higher IV than the Put, or equivalently, that the Put is trading at a lower IV than the Call. How do we capture this discrepancy? Well, let's do what feels right, sell the higher IV, the Call, and buy the lower one, the Put. The key is then to lock in the difference in IV by buying stock. This position is called a conversion, and the other side of it, i.e., long Call, short Put and short stock, is called a reverse conversion, or reversal. We'll work a numerical example assuming we sold 10 Calls, bought 10 Puts, and bought 1000 shares of stock.

There is a cost of carrying this $78,160 debit to expiration. Assuming an interest rate of 5%, that cost is: 78,160 x .05 x 135 / 365 = $1,445. So the total cost of this position at expiration is equal to: 78,160 + 1,445 = $79,605. Notice in the last 2 columns that the value of the position is $80,000, with stock prices of 76 and 86, 2 prices I chose at random. In fact, no matter what the value of the stock is at expiration, the value of the position will always be $80,000. Convince yourself.
So I put on a position for a debit of $79,605 and at expiration it's worth $80,000. Without regard to commissions and taxes, etc., I made a profit of $395. Guess what, the value of the Put at a 35 IV would be 5.39, and the difference between the 5.39 and 5.00, 10 times, is $390. This is within rounding error of the $395 that we just calculated. Also, for those of you, who are now thinking in terms of the Greeks, the Vega of the Put is .195. Therefore, we would expect to make 2 (35-33) volatility points or "clicks," as we say in the business, or 10 x 2 x .195 x 100 = $390. Notice that we can get the same result by several different methods. You're lucky, I'm resisting an all roads lead to Rome/Greeks joke.
VERTICAL SKEW
A vertical skew refers to the situation where in a given expiration month, the different strike prices trade with different implied volatilities. There are 2 main types of vertical skews; forward and reverse. A forward vertical skew is where volatilities are increasing from lower to higher strike, while a reverse vertical skew has volatilities decreasing as the strikes are increasing. For example,

Since the crash of 1987, many stock and index options have shown significant reverse skews. That makes the out of the money Puts more expensive than the equivalent out of the money Calls. The way I rationalize this is by considering that out of the 2 emotions that move the market, fear is a stronger emotion than greed. So when the markets are headed south, people will bid up the price of Puts by buying them without too much regard for the price. "I've got to protect what I own." On the other hand, when the market is moving higher, they may want to buy Calls, but they don't tend to chase them. The attitude is more like, "If I miss it, I'll get the next one."
There are positions, such as bull and bear spreads and others, that can be put on to take advantage of the different types of vertical skews, but we haven't discussed them yet. Trust me, we'll get there.
HORIZONTAL SKEW
A horizontal skew refers to the situation where at a given strike price, the different expiration months trade with different implied volatilities. There are 2 main types of horizontal skews; forward and reverse. A forward horizontal skew is where volatilities are increasing from the near months to the far months, while a reverse horizontal skew has volatilities decreasing from near months to far months. For example,

A reverse skew typically shows up when some sort of news event is on the horizon, such as an earnings announcement, FDA announcement, court case, merger, acquisition or spinoff, etc. It is also quite common for stocks to trade with a combination, forward and reverse horizontal skew. That's because regardless of what is happening in the very near term, LEAPS (options with more than 9 months to expiration) tend to trade with higher volatility than the shorter term options, since they are generally traded less and therefore less liquid.
Again, just like with the vertical skews, there are positions, like calendar spreads, that try to take advantage of the horizontal skew, but we're not there yet. Stay tuned.
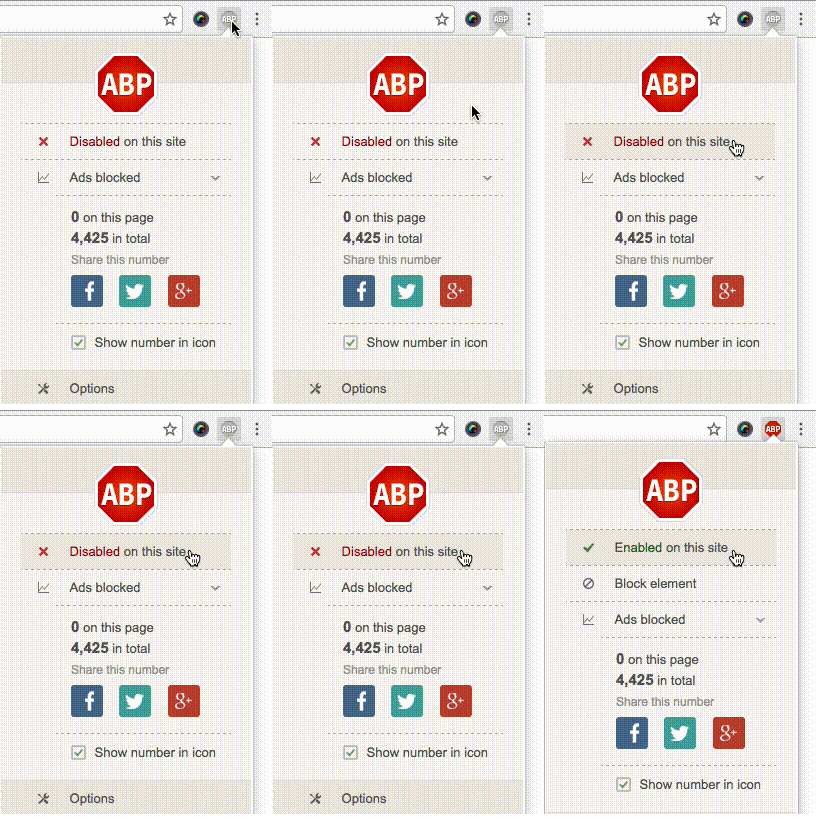
 选择“Disable on www.wenxuecity.com”
 选择“don't run on pages on this domain”

