To evaluate the long-term effectiveness of the ETF Investment System, I collected historical data from January 1950 to March 2012 for the following three assets: 3-month Treasury Bills (representing cash), 10-year Treasury bonds (representing long-term bonds), and S&P 500 Index (representing stocks). Then I calculate the value of the proprietary "Investment Value Index" for each of the three assets, and holding the one asset with the highest value of the "Investment Value Index" till it is replaced.
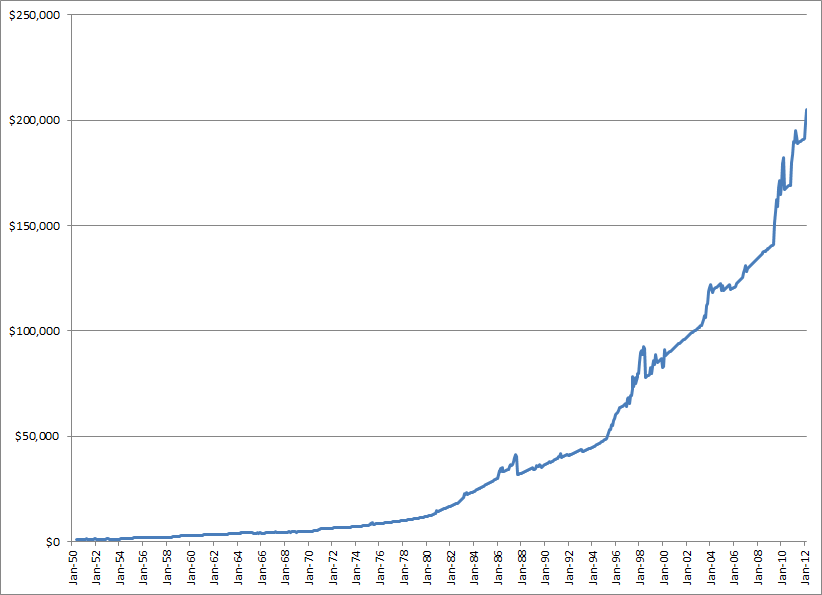
The following chart is the hypothetical equity growth curve from January 1950 to March 2012 (starting with $1000 initial capital):
For comparison, this is the price chart for S&P 500 Index from January 1950 to March 2012:
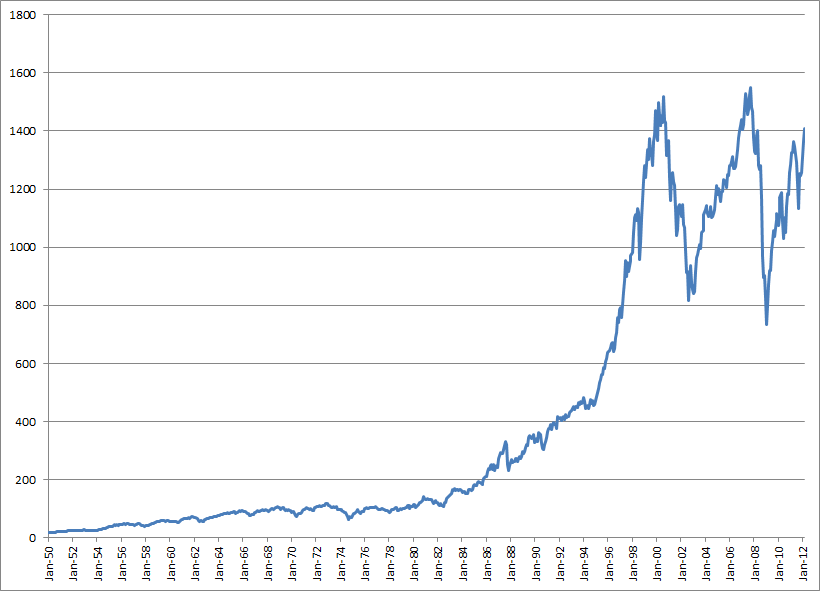
In the past 61 years, ETF Asset Management System increased the initial capital 205 times (from $1,000 to $205,287). Meanwhile, the return for S&P 500 Index was 79 times (from 17.69 to 1408.47).
In the evaluation process, I also found that it is imperative to exchange assets immediately whenever the ETF Asset Management System gives out a signal. In doing so, large market collapses such as in October 1987 and August 1998 could be circumvented. This just illustrate the importance of quick actions during major market transition periods.